
Why do SAST false positives happen?#
SAST tools analyze code without running it. That fundamental limitation means they have to make assumptions about how data flows through your application, and those assumptions are wrong often enough to be a real problem.
The four recurring root causes:
- Incomplete data-flow modeling — the scanner does not understand your ORM, framework, or sanitizer, so parameterised queries get flagged as SQL injection
- Framework blindness — Django auto-escaping, Spring CSRF defaults, and Rails strong parameters all defuse classes of vulnerabilities the scanner cannot see
- Context blindness — the tool does not know an input is limited to a dropdown or that an internal API is never internet-facing
- Over-broad default rule packs — vendor rules cast a wide net so the scanner never under-reports, but the cost is noise
Tuning, custom rules, and combining SAST with IAST or runtime evidence are the standard remediations covered below.
The most common cause is incomplete data flow modeling. A SAST tool traces user input from an HTTP parameter to a database query and flags it as SQL injection.
But the application uses an ORM that parameterizes queries automatically. The tool does not model the ORM, so it reports a vulnerability that does not exist.
Framework-specific behavior causes a similar pattern. Django’s template engine auto-escapes output by default.
Spring Security adds CSRF protection automatically. If the tool does not understand the framework, it flags every unescaped template variable and every form without a CSRF token — producing dozens of findings that are not real.
Context blindness is another driver. SAST sees your code in isolation.
It does not know that a particular input field only accepts values from a dropdown, or that an internal API is never exposed to external users. Everything looks like untrusted input.
Over-broad default rules compound the problem. Out-of-the-box rule sets are designed to work across many codebases.
They cast a wide net, catching potential issues even when the probability is low. This is safe from a vendor perspective but painful from a developer perspective.
The cost of false positives#
False positives are not just annoying. They erode developer trust in the security tooling, and once that trust is gone, real vulnerabilities get ignored alongside the noise.
Industry surveys consistently find that security teams spend significant time triaging false positives. The 2024 GitLab Global DevSecOps Report (gitlab.com/developer-survey ) and the OWASP Benchmark Project (owasp.org/www-project-benchmark ) both document that triage burden remains the dominant cost of SAST adoption.
The pattern is predictable. A team deploys SAST, the first scan produces 300 findings, developers investigate 20 of them and find that 15 are false positives.
They stop investigating. New critical findings get buried in the backlog alongside noise.
Six months later, someone finds a real SQL injection in production that SAST had flagged on day one but nobody triaged.
False positive fatigue also has a measurable impact on adoption. Teams that encounter high false positive rates in the first two weeks are significantly more likely to abandon the tool entirely.
The inverse is equally true: teams that invest in tuning during the first sprint tend to keep the tool running long-term.
The math is straightforward. A tool that produces 200 findings with a 50% false positive rate gives you 100 real vulnerabilities buried in 100 distractions.
A tuned tool that produces 120 findings with a 15% false positive rate gives you 102 real vulnerabilities with only 18 distractions. Same detection, far less wasted time.
Tuning built-in rules#
Start with rule severity and category filtering. You do not need every rule enabled.
Severity thresholds#
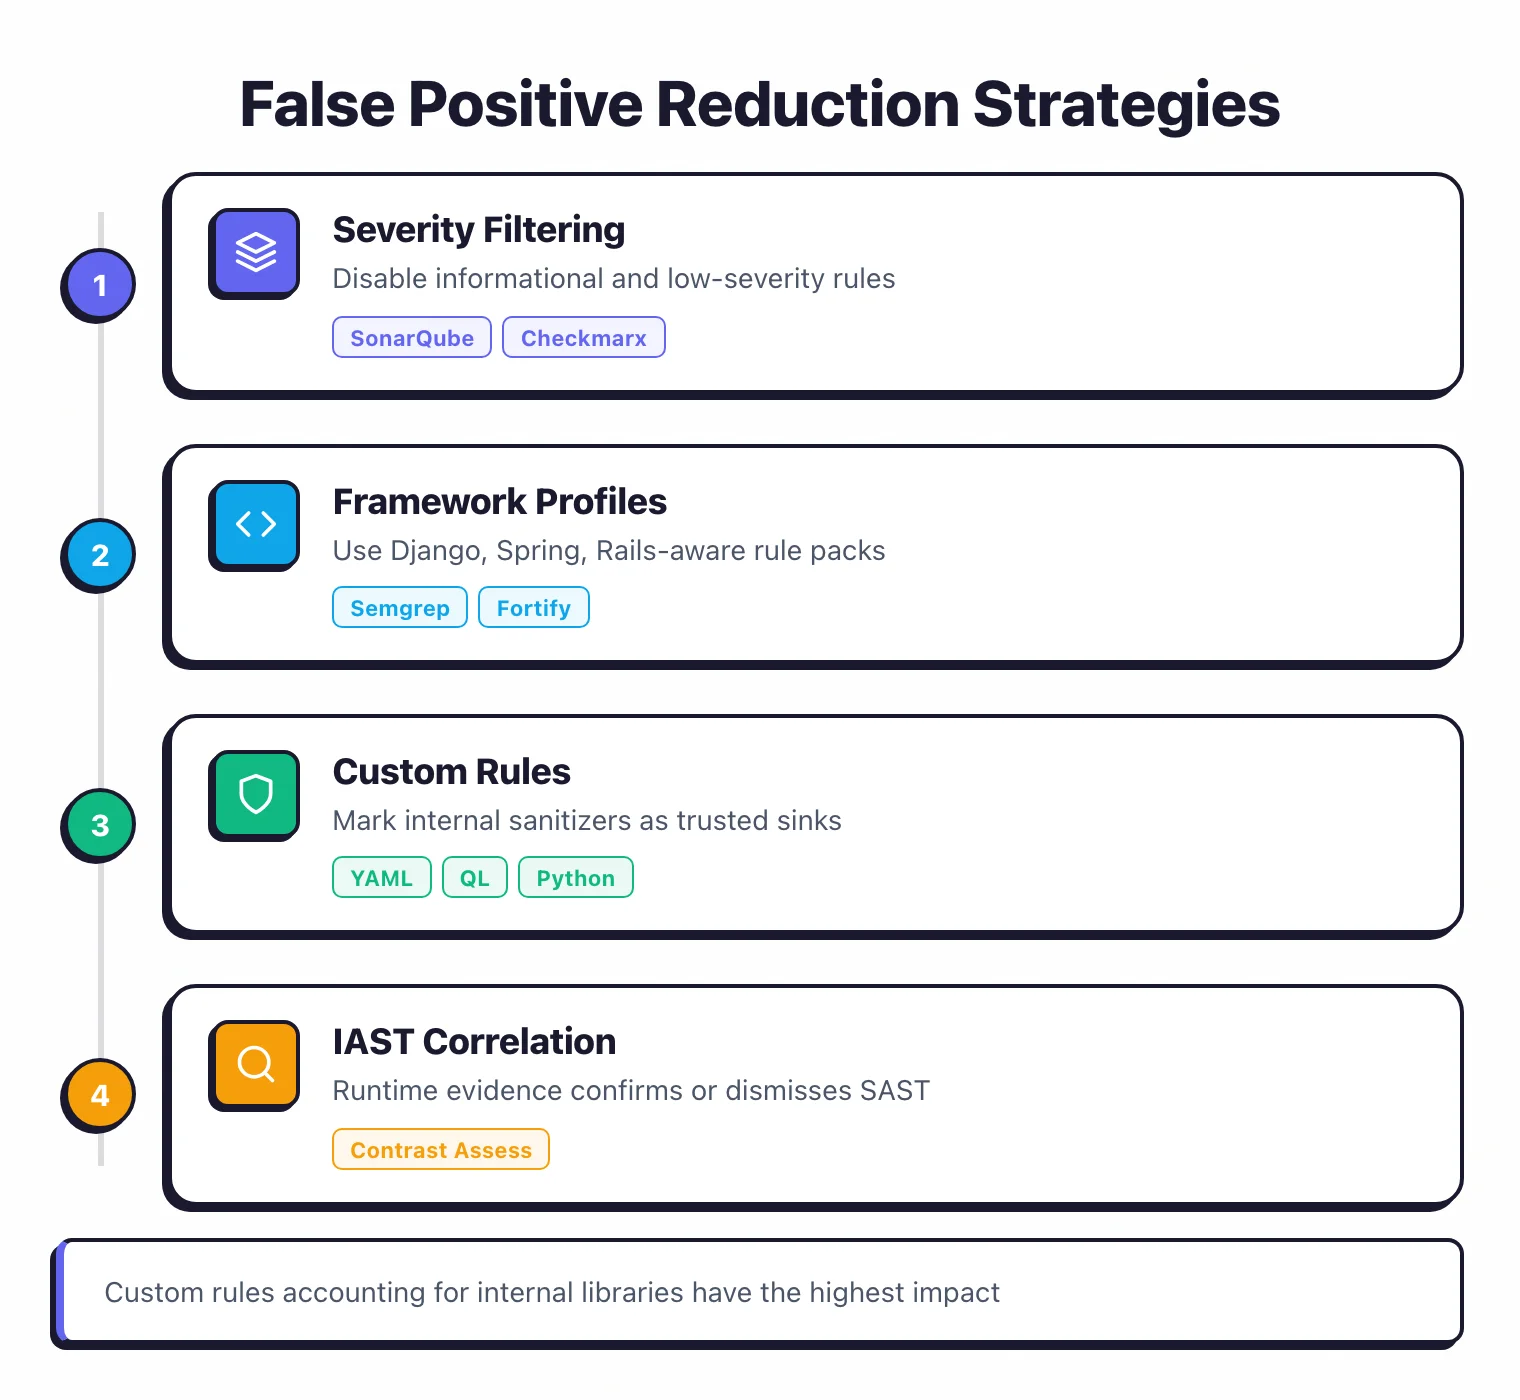
Most SAST tools classify findings as critical, high, medium, low, or informational. Start by disabling informational and low-severity rules entirely.
They produce the highest false positive rates and the lowest security value. Focus developer attention on critical and high findings first.
SonarQube lets you configure quality gates based on severity. Block merges on critical and high, warn on medium, ignore low. Checkmarx offers similar policy-based filtering at the project level.
Category filtering#
Disable rule categories that do not apply to your stack. If your Java application uses Spring Data JPA (which parameterizes all queries), disable raw SQL injection rules for JPA-annotated repositories.
If you use React with JSX (which escapes output by default), disable reflected XSS rules that ignore JSX’s built-in protection.
Framework-aware profiles#
Semgrep ships rule packs for specific frameworks: Django, Flask, Spring, Express, Rails. Use the framework-specific pack instead of the generic language pack.
The framework pack understands that render_template() in Flask auto-escapes by default, so it only flags Markup() or |safe filter usage.
Checkmarx
and Fortify
both support custom framework configurations where you mark specific functions as sanitizers. Once you tell the tool that sanitizeInput() is a trusted sanitizer, it stops flagging every data flow that passes through it.
Confidence thresholds#
Some tools assign a confidence score to each finding. Semgrep
rules are tagged with confidence: HIGH, MEDIUM, or LOW. Filter your CI pipeline to only show high-confidence findings initially, then gradually lower the threshold as your team gets comfortable with the tool.
Writing custom rules#
Generic rules work across many codebases. Custom rules work for yours.
Every codebase has internal patterns that off-the-shelf rules do not understand. Internal sanitization libraries, custom authentication wrappers, framework extensions.
Writing rules that account for these patterns is the single highest-impact thing you can do to reduce false positives.
Semgrep custom rules#
Semgrep makes writing custom rules accessible. The YAML-based syntax matches code patterns directly, without requiring you to learn a complex query language.
A practical example: your team uses a custom SafeQuery wrapper that always parameterizes SQL queries. Semgrep keeps flagging calls to SafeQuery.execute() as potential SQL injection.
Write a rule that excludes any data flow that passes through SafeQuery:
rules:
  - id: sql-injection-ignore-safequery
    patterns:
      - pattern: $DB.execute($QUERY)
      - pattern-not: SafeQuery.execute(...)
    message: Potential SQL injection
    severity: ERROR
This eliminates an entire class of false positives in minutes.
CodeQL custom queries#
GitHub CodeQL uses a full query language (QL) that lets you write more sophisticated analysis. You can define custom sources, sinks, and sanitizers for your specific codebase.
The learning curve is steeper than Semgrep, but the analysis depth is greater.
SonarQube profiles#
SonarQube lets you create custom quality profiles that enable, disable, or adjust the parameters of individual rules. You can clone the default profile and modify it for your project.
This is less flexible than writing new rules, but it does not require learning a rule language.
Rule maintenance#
Custom rules need maintenance. When your internal libraries change, the rules need to change with them.
Treat custom security rules like code: version-control them, review changes, and run them through CI. Semgrep makes this easy because rules live as YAML files alongside your source code.
Incremental scanning#
Full repository scans produce noise at scale. A 500,000-line codebase generates hundreds of existing findings every time you scan, most of which were already triaged. Incremental scanning limits analysis to code that actually changed.
Scan only changed files#
Configure your CI pipeline to pass only modified files to the SAST tool. Most tools support this natively. Semgrep
accepts a list of changed files via --include.
SonarQube’s pull request analysis only reports new issues on changed code. Checkmarx supports incremental scans that skip unchanged files.
This reduces both scan time and the number of findings developers need to review. A pull request that changes three files should produce findings for those three files, not for the entire repository.
Baseline management#
When you first deploy SAST on an existing codebase, baseline the current findings. Mark them as “existing” and do not surface them in pull requests.
Require all new code to pass clean. Fix baseline issues on a separate schedule.
SonarQube does this through its “new code” definition — you pick a date or branch and only new issues show up. Checkmarx supports baseline projects that track known findings across scans.
Differential analysis#
Some tools go beyond file-level incremental scanning. They analyze only the code paths affected by a change.
If you modify a function, the tool traces data flows that pass through that function and skips everything else. Snyk Code and Checkmarx both do this with varying levels of granularity.
How does combining SAST with IAST reduce false positives?#
This is the most effective technique for reducing false positives, and it is underused.
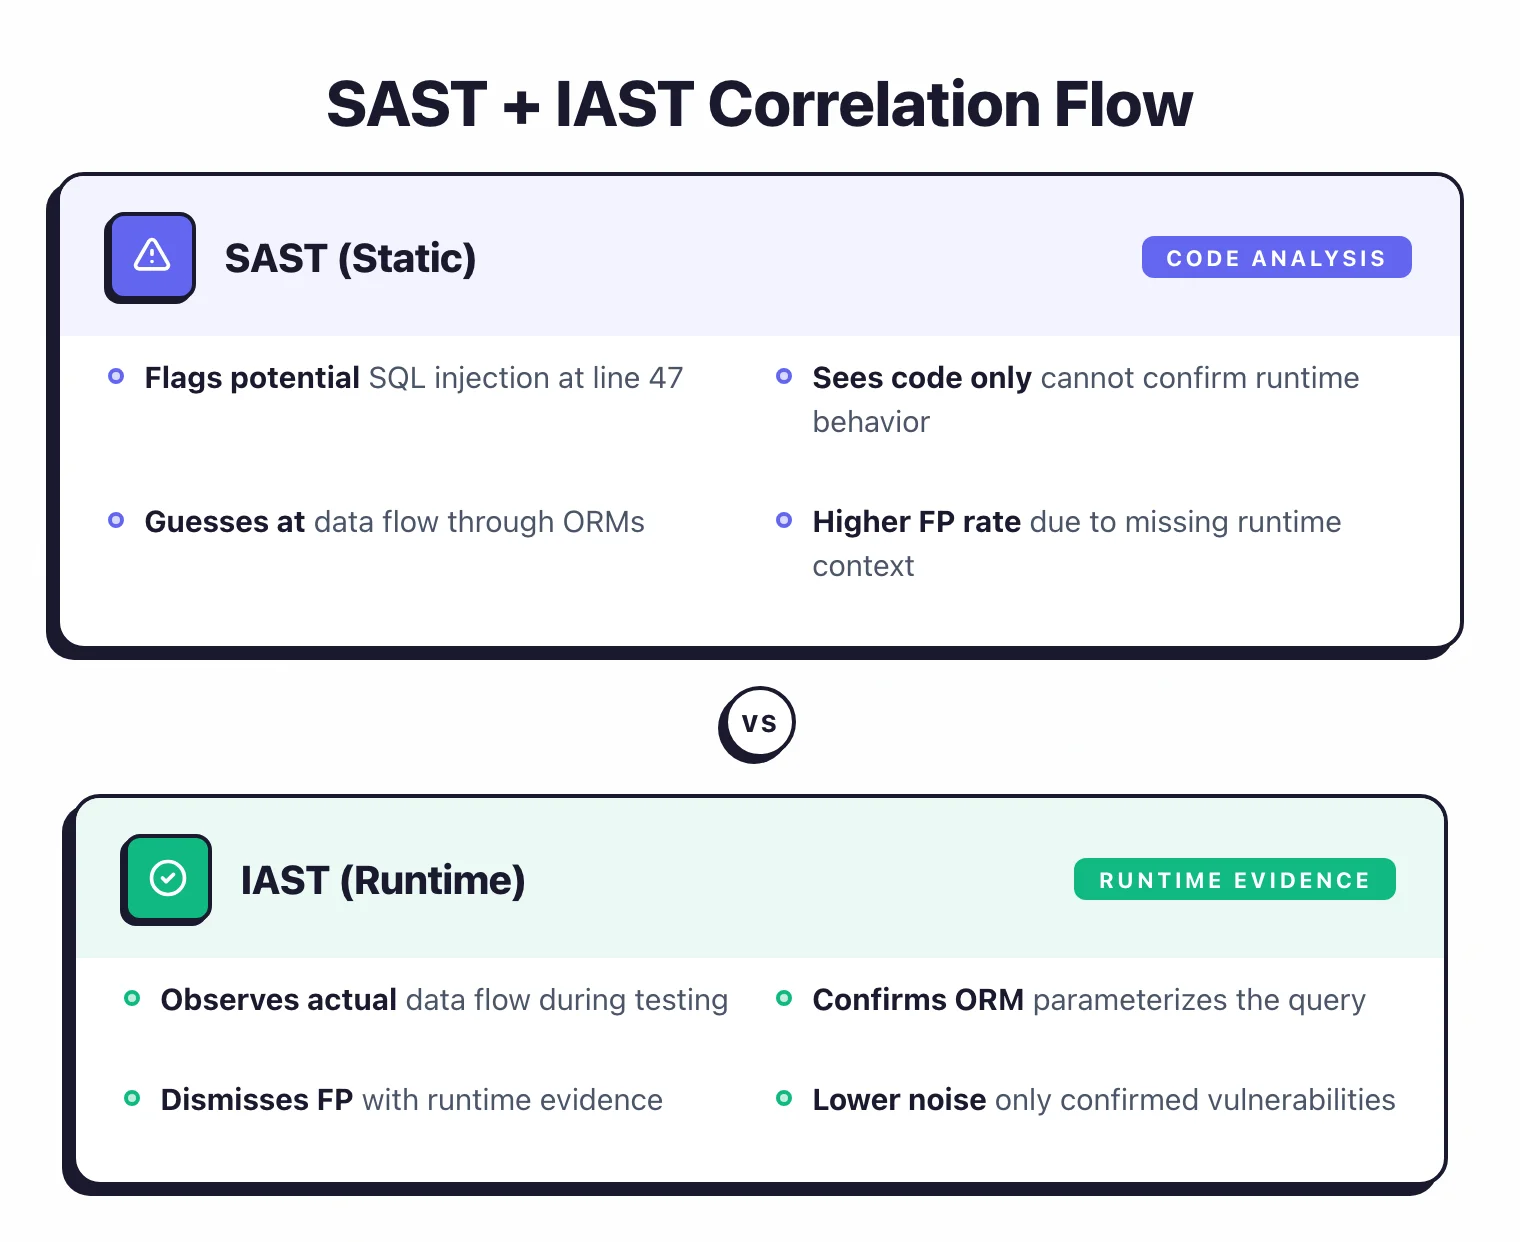
SAST analyzes code statically and guesses at runtime behavior. IAST instruments the running application and observes actual data flows — the SAST vs DAST vs IAST comparison lays out the trade-offs in full. When you combine them, IAST can confirm or dismiss SAST findings with runtime evidence.
Here is how it works in practice. SAST flags a SQL injection in UserService.java at line 47.
The data flow shows user input reaching a query without sanitization. But does it actually happen at runtime?
IAST instruments UserService during testing, watches the data flow, and confirms that an ORM layer parameterizes the query before it reaches the database. False positive confirmed — automatically.
Contrast Assess (IAST) can ingest findings from SAST tools and correlate them with runtime observations. If the IAST agent observes that a flagged data flow is actually sanitized at runtime, the finding gets downgraded or dismissed.
This correlation is not always automatic. Some teams run both tools and manually cross-reference findings.
Even manual correlation helps: if IAST has never observed the vulnerability that SAST keeps flagging, it is probably a false positive.
The trade-off is setup complexity. IAST requires an agent in your application runtime, which means your QA or staging environment needs to run the instrumented build.
See our IAST explainer and the Contrast Security vs Seeker comparison for guidance on tool selection.
AI-assisted false-positive reduction (2026 update)#
The 2026 SAST landscape added a layer the previous techniques don’t cover: large language models running as a triage filter on top of conventional analyzers. Three patterns dominate the space.
LLM-as-filter runs after the SAST scan completes. The model reads each finding alongside the surrounding code context and classifies it as likely-true-positive or likely-false-positive with a confidence score. Snyk Code
ships this as DeepCode AI Fix; GitLab SAST
Ultimate ships it as the GitLab Duo false-positive analyzer; Checkmarx
ships it inside Checkmarx One Assist. The pattern works because LLMs handle the contextual reasoning humans usually do during triage — recognizing that a query.toString() call sits behind an ORM parameterization layer, or that an unsafe-looking eval() is gated by an input-allowlist function defined three files away.
Memory-aware rule packs keep a history of which findings each team has previously dismissed and apply that signal to new scan results. Semgrep’s “AI-powered memory” implementation is the most documented example — each suppression is treated as a training signal that informs how similar findings are scored on the next scan. The effect is gradual: a codebase that started at 50% false-positive noise tends to converge toward 10-20% over a few weeks of active triage as the memory layer learns the team’s patterns.
Agentic remediation generates a fix PR for findings the LLM filter classified as true positives. Mobb, Corgea, Checkmarx One Assist, and the Datadog Application Security Code agent all ship variants of this. The remediation step matters for false-positive reduction because it short-circuits the triage queue: if the AI generates a clean fix the developer can merge in two minutes, the cost of a low-confidence true positive drops, which moves the optimal triage threshold further toward “trust the scanner”. Combined, these three patterns push tuned-deployment false-positive rates below 10% on greenfield projects, though brownfield codebases with heavy custom-framework usage still benefit most from the manual rule-tuning techniques described above.
The honest framing for 2026: AI-assisted triage is a multiplier on top of the rule-tuning, custom-rule, and SAST+IAST techniques in this guide — not a replacement for them. Vendors that ship LLM filtering still benefit from clean rule configuration upstream.
Suppression workflows that don’t hide real bugs#
Suppressing false positives is necessary. Doing it carelessly creates a different problem: real vulnerabilities hidden behind suppression comments that nobody reviews.
Inline suppressions with justification#
Most tools support inline suppression comments: // NOSONAR, # nosec, // nolint. Always require a justification. // nosec — input validated by middleware auth layer (see AuthFilter.java:23) is useful. // nosec alone is not.
Enforce justification requirements through code review. If a suppression comment does not explain why the finding is a false positive, reject the PR.
Centralized suppression management#
Checkmarx and SonarQube let you mark findings as “not exploitable” or “won’t fix” in their dashboards. This is better than inline comments because a security team member can review all suppressions in one place.
But it can drift: suppressed findings should be re-evaluated when the underlying code changes.
Expiring suppressions#
Some teams set expiration dates on suppressions. A finding marked “not exploitable” gets automatically re-opened after 90 days for re-review.
This prevents stale suppressions from accumulating. Semgrep
supports nosemgrep with the expectation that the team periodically audits suppressions. Build this audit into your quarterly security review.
The review gate#
Add a suppression review gate to your process. Any finding that gets suppressed should be reviewed by someone other than the developer who wrote the code.
This catches the cases where a developer suppresses a finding because it is hard to fix, not because it is a false positive.
Measuring your false positive rate over time#
You cannot improve what you do not measure. Track your false positive rate as a percentage over time, and use it to evaluate whether your tuning efforts are working.
The basic metric#
False positive rate = (findings confirmed as false positives) / (total findings triaged) * 100.
This requires that your team actually triages findings — marking each one as a true positive, false positive, or not applicable. Most commercial SAST tools track this natively.
With open-source SAST tools , you may need to track it in a spreadsheet or issue tracker.
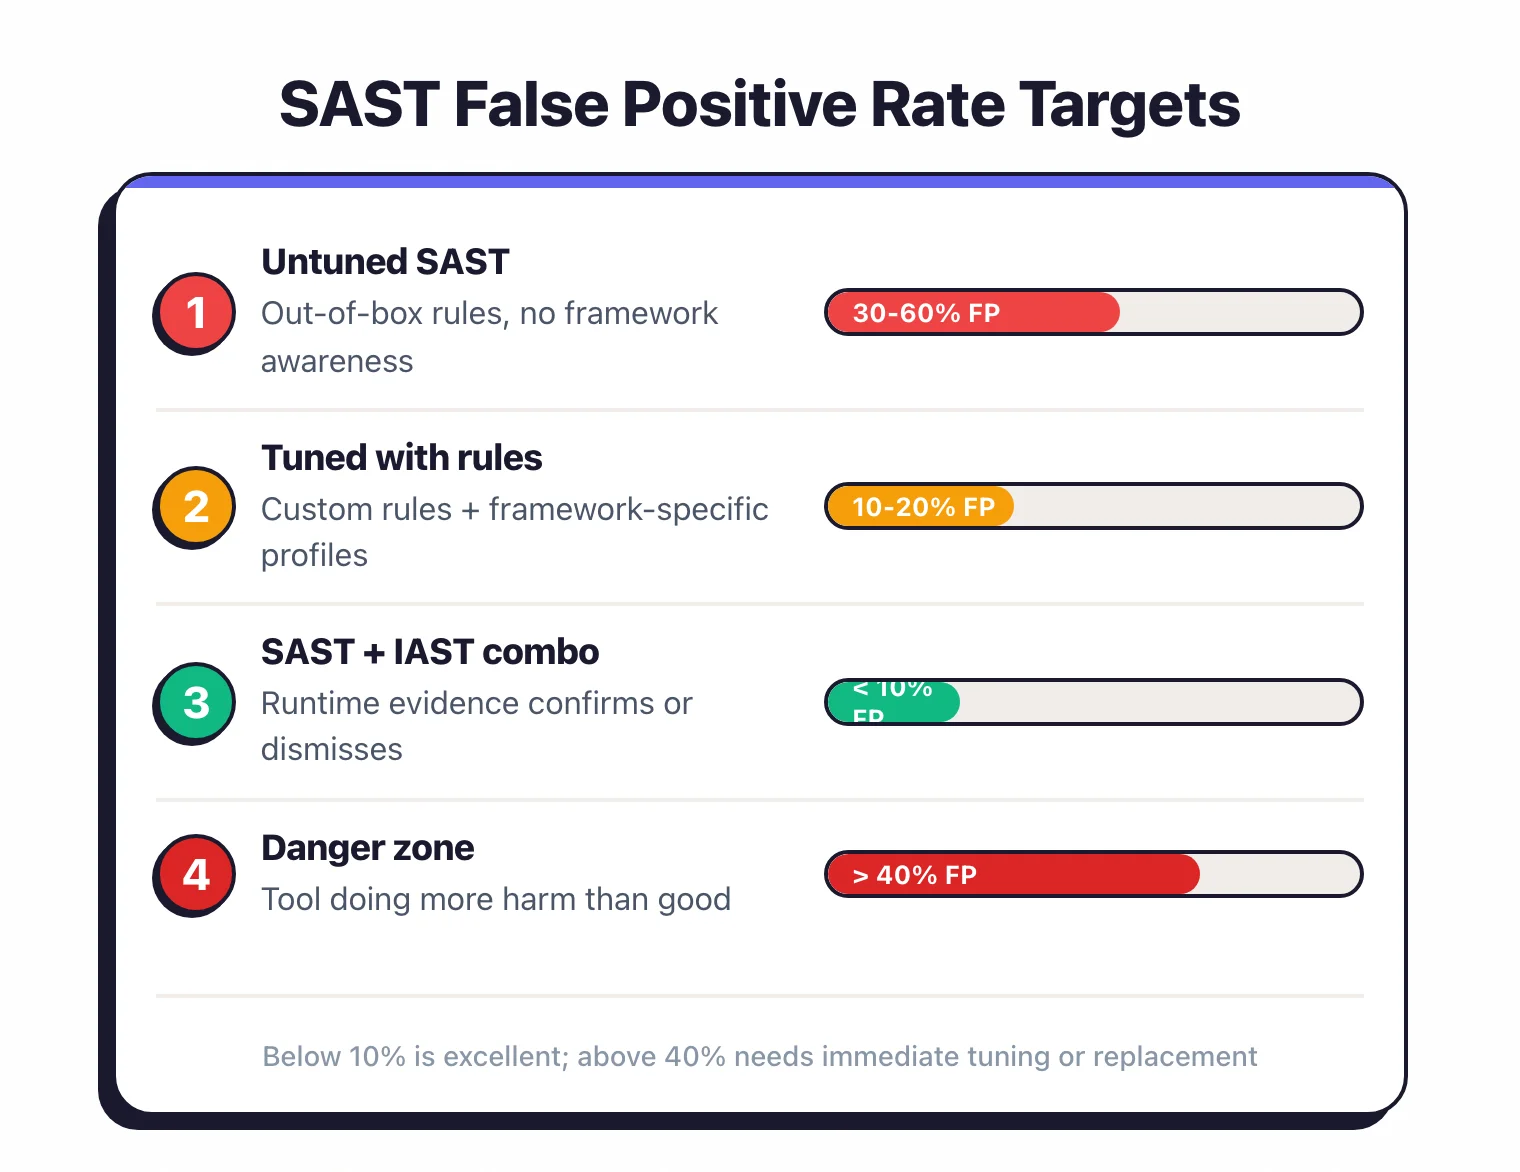
Target ranges#
- Below 10%: Excellent. Your tool is well-tuned and developers trust the findings.
- 10-20%: Good. This is a realistic target for most teams.
- 20-40%: Needs work. Developers are starting to lose patience.
- Above 40%: The tool is doing more harm than good. Prioritize tuning immediately or switch tools.
Trending over time#
Plot your false positive rate monthly. It should trend downward as you add custom rules, tune severity thresholds, and build framework-specific configurations.
If it is flat or rising, your tuning is not keeping up with codebase changes.
A rising rate after a framework migration or major refactor is normal. Update your custom rules and framework configurations to match the new code patterns.
Feedback loops#
Create a process where developers can flag false positives directly from their pull request. A “not a bug” button or a dedicated Slack channel works. Route these to the security team for rule tuning.
The developers who see the most false positives are the best source of information about which rules need adjustment.
Track which rules produce the most false positives. If one rule generates 60% of your noise, fix that rule.
The top five noisiest rules often account for the majority of false positives across the entire scan. AppSec Santa maintains detailed reviews of all SAST tools mentioned in this guide.
Sources#
- OWASP Static Code Analysis control — community reference on tuning workflows.
- OWASP Benchmark Project — open false-positive / false-negative baseline for SAST tools.
- NIST SAMATE — definitions of FP/FN and reference test suites.
- Snyk Code platform page — vendor’s published false-positive reduction claim.
- Semgrep policies documentation — adaptive triage and policy management.
- Checkmarx glossary — vendor reference for incremental SAST and related terms.
- Contrast Security influencers blog — runtime correlation methodology.