


Trace is an AI-native whitebox penetration testing service in the DAST family.
In a Trace pentest, AI agents read your source code and cloud configuration, then attempt real exploits against a staging environment you designate.
The service is operated by Clerk Technologies, Inc. under the Trace name, and its terms are governed by Delaware law. Pricing is public, starting at $4,000 per test.
The site lists Flagright, LlamaIndex, Metal, DevRev, Candid Health, MuralPay, Bastion, PointOne, and Credal among its customers.
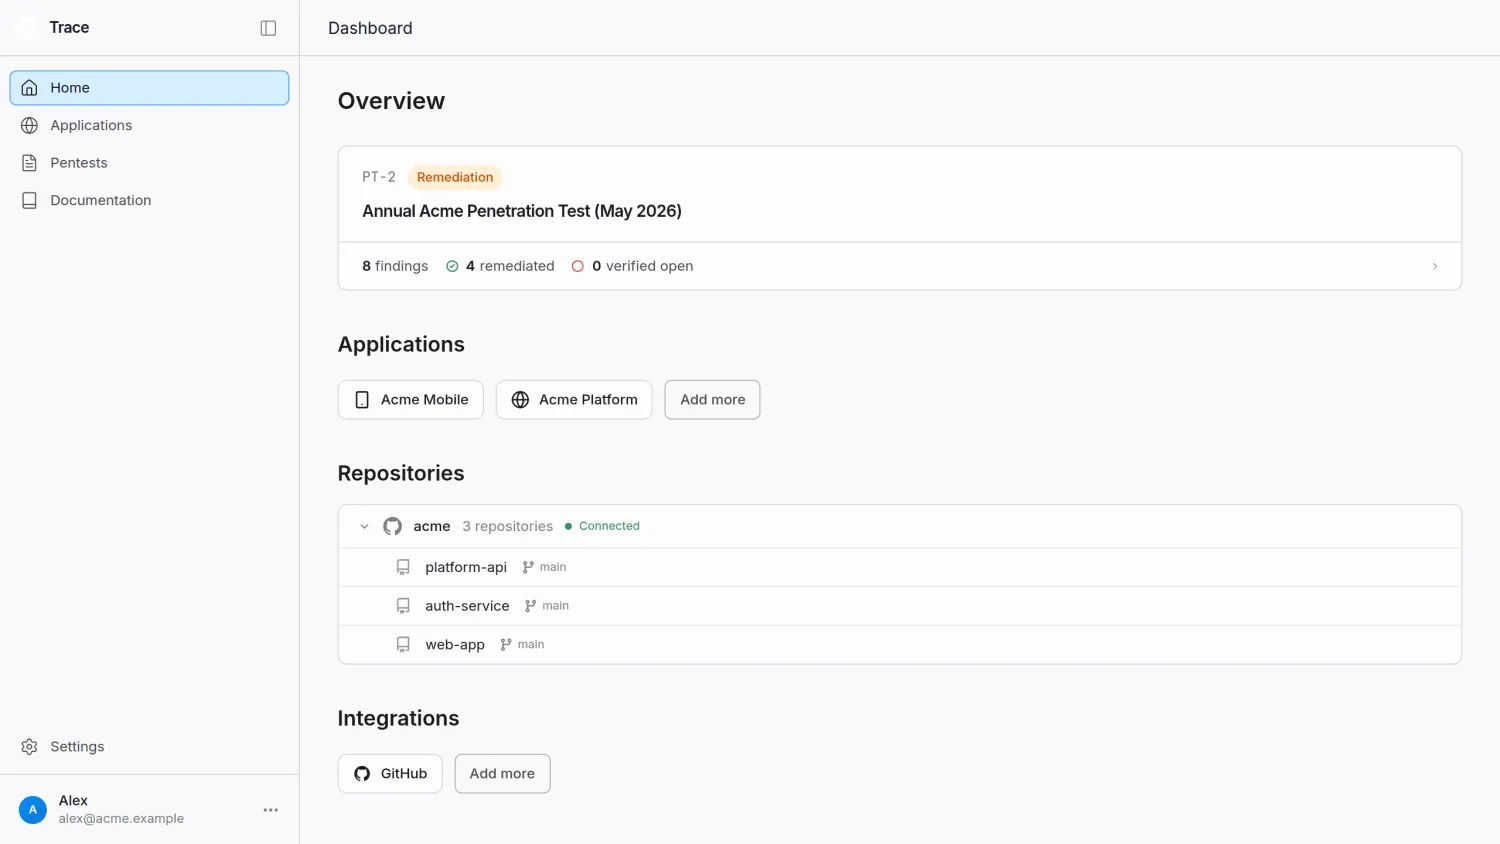
What is Trace?
Trace runs a whitebox pentest. It clones your repository into an isolated, ephemeral environment and reads the auth model, the data flows across services, and the business logic before it attacks.
The vendor contrasts this with black-box testing, which guesses at what sits behind an endpoint. Reading the handler behind each request is how Trace finds business-logic flaws, broken object-level authorization, and cross-tenant gaps.
Detection is half the pipeline. A validation sub-agent logs in to your staging stack and tries each candidate exploit, and an OSCP-certified engineer signs off before anything reaches the dashboard.
| Capability | Details |
|---|---|
| Testing approach | Whitebox: read-only clone of source plus a live environment with credentials |
| Surfaces | Startup covers one web app or API; Scale adds network, desktop, mobile, CLI, cryptography, and LLM surfaces such as MCP servers and AI chat |
| Validation | Live exploitation on staging for injection, XSS, authorization bypass, SSRF, and open redirects |
| Human review | OSCP-certified engineer reviews every finding; private Slack channel with the Trace team |
| Scoring | Severity tier plus CVSS score and vector, CWE, and OWASP Top 10 mapping (web, LLM, mobile, API) |
| Deliverables | Penetration test report and signed letter of attestation for SOC 2, ISO 27001, HIPAA; PCI DSS and CASA on Scale and Enterprise |
| Retests | Unlimited; results in minutes after a fix is deployed |
| Purchase modes | One-time engagement priced per test, or continuous coverage priced per year |
How much does Trace cost?
Trace publishes its prices on its pricing page . Every tier is sold as a one-time engagement priced per test or as continuous coverage priced per year.
| Tier | One-time | Continuous | Scope |
|---|---|---|---|
| Startup | $4,000 per test | $19,000 per year | Up to 500,000 billable lines; one application (a web app or API) |
| Scale | $12,000 per test | $48,000 per year | 500,000 to 2 million lines; up to 5 applications; network, web, desktop, mobile, CLI, cryptography, and LLM surfaces; PCI and CASA coverage |
| Enterprise | Custom | Custom | Over 2 million lines with no application cap; bring-your-own-key inference; self-hosted deployment |
| Managed Remediation | Quoted add-on | Quoted add-on | Trace engineers ship fixes as reviewed pull requests and retest on pre-production |
Both purchase modes include unlimited retests. Continuous coverage adds one official pentest report a year, which the vendor says can stand in for an annual pentest.
Trace’s documentation compares Startup to a focused two-week manual pentest and Scale to a broader four-week one. Treat both as vendor positioning when you weigh them against a consultancy quote.
Billable lines are first-party code that is neither blank nor a comment. Tests, documentation, configuration and data files, and vendored or generated code are excluded.
The count is reproducible. Trace runs the open-source scc counter with ignore files disabled, and the dashboard shows how the total splits across each excluded bucket.
cd /path/to/your/repo
scc --no-gitignore --no-ignore --no-scc-ignore .
Admins and analysts can trigger a recount up to 10 times in 24 hours. A repository excluded from scanning drops out of the billable total.
How does a Trace pentest work?
Trace models the target with three objects: an application, an environment, and a credential. The application links to the repositories Trace reads.
The environment is a deployed instance with a reachable URL, typically staging. The credential is how Trace signs in as a real user.
Supported credential types include email and password, bearer and JWT tokens, session cookies, API keys, passphrases, saved session state, and SSH private keys.
For logins that send a magic link or one-time code, Trace’s agents have a dedicated inbox. They receive the message and complete the sign-in the way a person would.
Once analysis produces a candidate finding, a validation sub-agent takes over in a sandbox with short-lived, scoped access. The vendor documents four steps:
- Read the finding: the attack vector, the affected endpoint or code path, and the expected impact.
- Authenticate to the designated environment with the configured credential.
- Send the request, payload, or sequence of operations the finding describes.
- Observe the outcome. If the impact reproduces, the finding is marked verified and the reproduction is captured. If nothing reproduces, it is dropped or routed to human review.
Trace validates only findings it can reproduce safely. Anything that could cause data corruption, persistent state changes, or production impact is not exploited.
Those findings still ship with code citations, a threat-model write-up, and engineer review, but without an exploitation artifact.
Pentests are manual by design. Trace never starts an engagement automatically; testing runs only when you or the Trace team launch it against the application, environment, and time you choose.
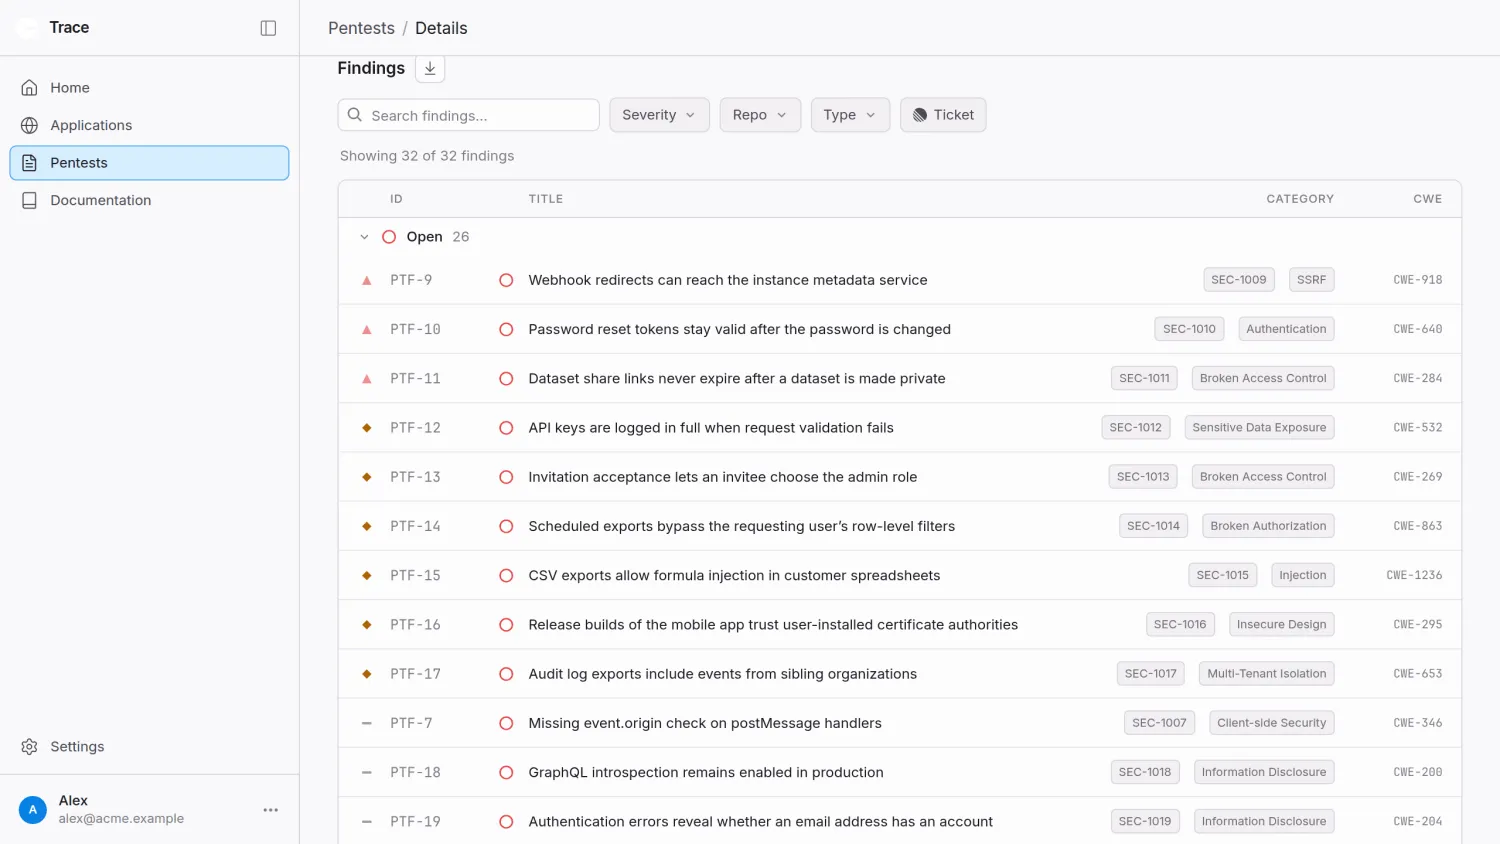
What does a Trace finding contain?
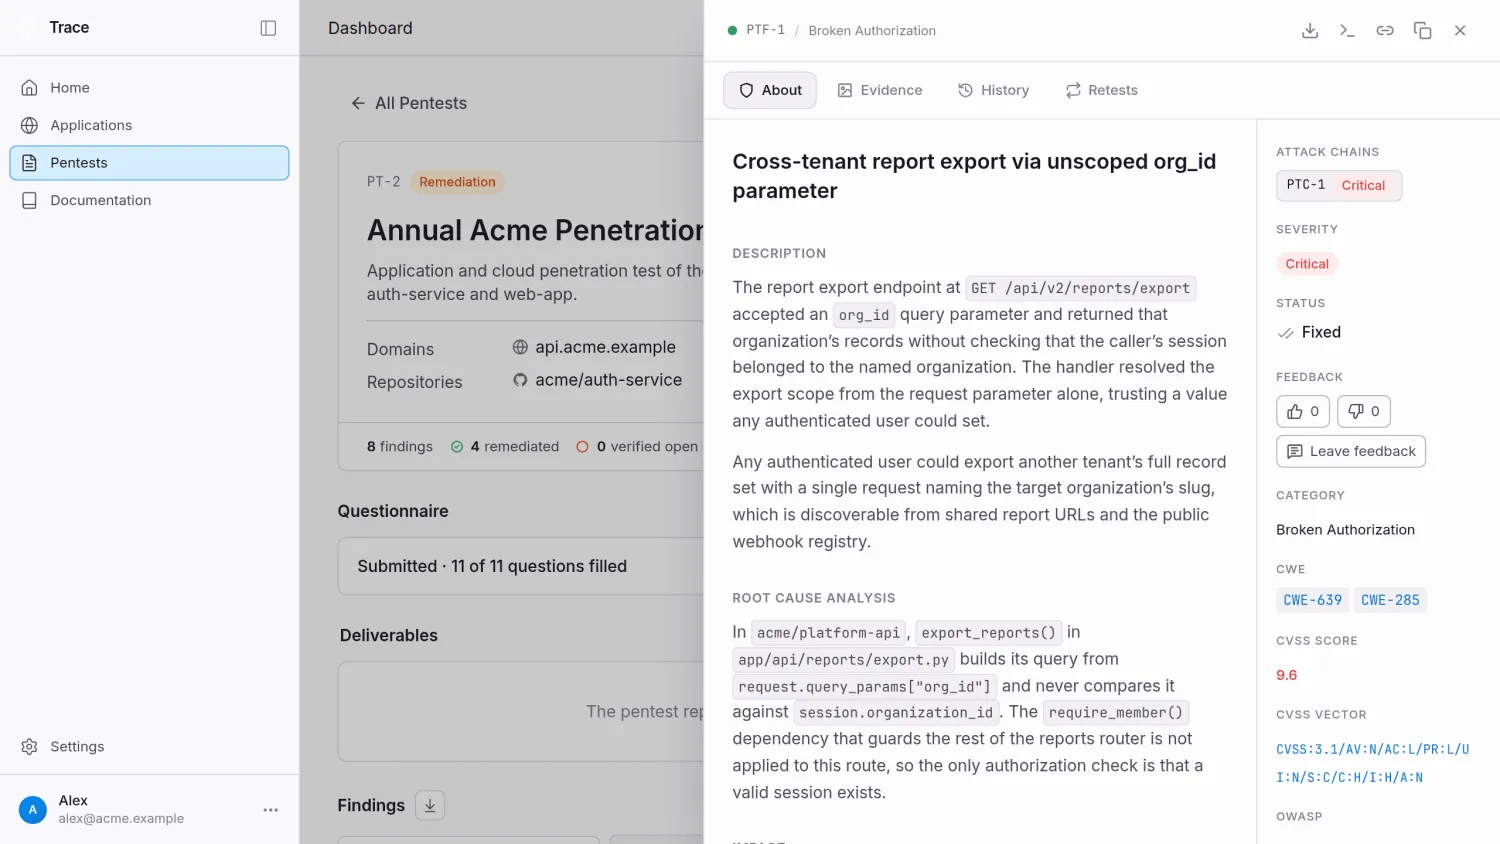
Each finding carries a severity tier from Informational to Critical, with a CVSS score and vector. It also carries the vulnerability category, its CWE, and its OWASP Top 10 classification.
The root cause section names the affected repository, file, and line range. The attack scenario lists the attacker’s steps and the requests and responses Trace captured to prove them.
A remediation section states what to change and what Trace observed on retest.
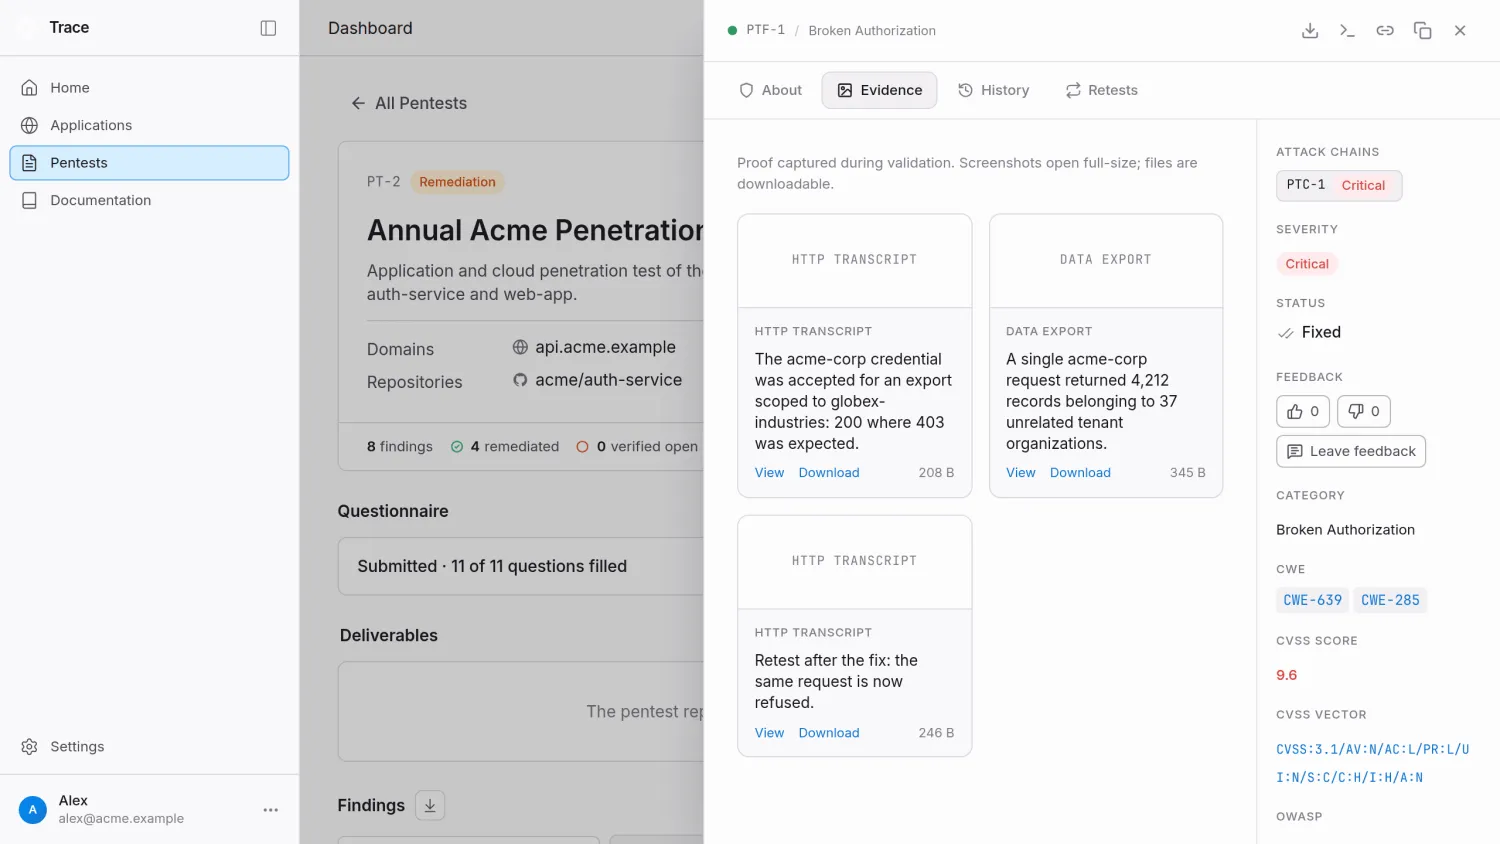
For findings validated by exploitation, the Evidence tab holds the reproduction artifact. Depending on the finding type, that is an HTTP capture, a browser video, or an agent transcript.
It also records the data or access actually gained, not what analysis inferred.
Findings move through a documented lifecycle. Every state change records the actor, action, and timestamp for audit.
| Status | Meaning |
|---|---|
OPEN | Reported and not yet worked |
IN_PROGRESS | A developer has picked it up |
REMEDIATED | Fix shipped, ready for retest |
VERIFIED_FIXED | Trace retested and the exploit no longer fires |
VERIFIED_OPEN | Trace retested and the issue still reproduces |
PARTIALLY_FIXED | The original exploit is closed, but a variant still reproduces |
ACCEPTED_WITH_CONTROLS | You accept the risk; a written rationale is required and appears in the report |
CONTESTED | You dispute the finding; Trace decides whether to dismiss it, accept it, or keep it open |
DISMISS | Trace closes the finding |
Findings surface in three places: the dashboard, the CLI, and Slack or email notifications.
What does the Trace report look like?
Trace publishes a 29-page sample report .
It opens with an engagement block naming the testing window, the methodology (white-box, exploit-gated, CVSS v3.1), the tester with certifications (OSCP, CISSP), and an approver.
The body has four numbered sections: an executive summary with findings by severity, key themes and recommendations, the threat ranking methodology, and a findings summary table.
That table lists each finding’s ID, severity, CWE, CVSS score, and status. The sample engagement lists 10 findings, 8 of them remediated and verified.
Severity follows the standard CVSS v3.1 bands: 9.0 and above is Critical, 7.0 to 8.9 High, 4.0 to 6.9 Medium, 0.1 to 3.9 Low, and 0.0 Informational.
Every vector in the sample starts with CVSS:3.1, and so does the one in the docs’ dashboard screenshot. A report-cover graphic on the homepage says CVSS v4.0, so confirm the version if your risk register expects v4.0 scores.
Three appendices follow: assessment scope, Trace methodology, and per-finding detail. The methodology appendix describes five phases: reconnaissance, threat modeling, exploit-gated discovery, triage and scoring, then reporting and retest.
Each per-finding entry carries the CVSS vector, root cause, impact, attack scenario, proof of concept, remediation, and what the retest observed.
The report ships with a signed letter of attestation. Trace positions both documents for SOC 2, ISO 27001, HIPAA, PCI DSS, and vendor security reviews.
What does Trace integrate with?
Trace’s position is that the more context you connect, the deeper the test. Source code is mandatory. Everything else is optional but changes what the agents can reason about.
| Layer | Integrations | Access model |
|---|---|---|
| Source code | GitHub App, Bitbucket Cloud (Forge app); GitLab shown on the site | Read-only; clone tokens are short-lived and requested per engagement |
| Cloud inventory | AWS, GCP, Vercel, Convex (Azure on the roadmap) | Read-only; AWS through a cross-account IAM role, GCP keyless through Workload Identity Federation. Convex has no read-only key, so Trace stores a full-access deploy key and enforces read-only in its own code |
| Knowledge base | Slack, Confluence, Notion | Intended behavior, so a real flaw can be told from expected functionality |
| Issue tracking | Linear, Jira | One ticket per finding, linked back to the report |
| Notifications | Slack, email | Critical findings as they land |
| Logs and telemetry | Sentry, Datadog, Grafana | Marked “coming soon” on the vendor site |
The AWS integration inventories accounts, regions, and key resource types on a recurring basis and tags internet-facing resources. During an engagement, Trace uses that topology to confirm whether a weakness is reachable.
The Linear integration is the documented tracker path. Tickets are created singly or in bulk (up to 10 per request), and moving a ticket to Done marks the finding REMEDIATED in Trace.
Linear tickets carry the fix guidance but not the proof of concept. Exploit steps and evidence stay inside Trace’s access controls, even when the ticket is visible across your workspace.
Trace’s llms.txt also names CircleCI, Jenkins, Kubernetes, Terraform, and the compliance platforms Vanta, Drata, and Secureframe. None has a documentation page yet, so I would confirm each before relying on it.
 GitHub
 Bitbucket
 AWS
AWS GCP
GCP Linear
 Jira
Jira Slack
SlackHow does the Trace CLI work?
Trace ships a terminal client, tracecli, as an npm package. It runs on the Bun runtime, so bun needs to be on your PATH.
It covers authentication, organization context, application and environment setup, credentials, repositories, source uploads, code-size measurement, and pentest findings.
npm install -g securewithtrace
tracecli --help
Two credential sources are supported. A long-lived TRACE_API_KEY (prefixed trace_sk_) is the path for CI and other non-interactive use.
tracecli auth login runs a device-flow login instead. It stores a WorkOS JWT and refresh token under ~/.trace/.
Some commands require a human session and reject API keys: application, environment, and credential writes, source uploads, and org update. The API returns 403 Human principal required for this operation for those.
| Command group | What it does |
|---|---|
auth login / logout / status | Device-flow login, token removal, current session; status exits 1 when not logged in |
org list / current / switch | Pick the active organization; switch refuses to run while TRACE_API_KEY is set |
application, environment, credential | Create and manage the three target primitives |
inbox | Dedicated mailboxes the agents use to receive magic links and one-time codes |
repo list / filter / clone | Work with synced repositories |
upload | Push a source archive when a repository cannot be connected directly |
pentest questionnaire | View or fill the optional intake questionnaire that helps scope an engagement |
pentest findings list / get / status-update | Pull findings, with --detail for full write-ups, and move one to IN_PROGRESS, REMEDIATED, or ACCEPTED_WITH_CONTROLS |
The --detail flag returns every prose section of each finding. The docs present this as a way to hand a whole engagement to a coding agent, which then marks each fix REMEDIATED for retest.
List commands render through an interactive pager on a TTY. Passing --output json or --output tsv, or setting NO_PAGER=1, skips it for scripts.
How does Trace handle your source code?
A whitebox pentest hands the vendor your code, so this section matters more than it would for a black-box scanner.
Trace documents the controls on its data handling page .
The repository clone lives only for the engagement and is destroyed afterwards. What persists is the findings, the report, and reproduction artifacts, with a small code snippet at each affected location.
Trace states that its LLM provider contracts prohibit training on customer content and that the models are configured for zero data retention.
| Control | Vendor statement |
|---|---|
| Source retention | Ephemeral clone, destroyed after the engagement; snippets only in findings |
| Model training | Prohibited by contract; zero data retention configured with LLM providers |
| GitHub App scope | Read-only; no write to contents, no org settings, no ungranted repositories |
| Cloud access | Read-only; AWS role with a per-organization external ID, GCP metadata-only with no service-account keys |
| Credentials | Managed secret store, scoped to one environment, never written to logs or audit trails |
| Encryption and isolation | TLS 1.2 or higher in transit, encrypted at rest; tenant isolation enforced at the database layer |
| Internal access | Restricted, audited, customer permission required beyond aggregate diagnostics |
| Identity | SSO via WorkOS: SAML 2.0 (Okta, Entra, OneLogin, JumpCloud, Auth0, Ping), OIDC, Google, Microsoft; SCIM on enterprise plans |
| Roles | Developer, Analyst, Admin, each a superset of the previous |
| Audit log | Forwarded to WorkOS Audit Logs; in-product view on the roadmap |
The trust center lists four documents shared on request: a penetration test summary, an information security policy, a subprocessor list, and a data processing agreement. Some are NDA-gated.
It does not list a SOC 2 report. I would ask whether one exists, and what it covers, before granting repository access.
How do you get started with Trace?
You can sign up with a work email or book a 30-minute demo. Onboarding is hands-on: Trace’s team runs the first engagement alongside you and calibrates scope before you rely on the output.
- Account provisioning in WorkOS, with SSO and SCIM wired up if you need them.
- Install the Trace GitHub App or connect a Bitbucket Cloud workspace, then select repositories.
- Define the application, its environment URL, and a credential; optionally connect AWS, GCP, or Vercel.
- Trace runs the engagement, validates each finding, and an engineer reviews the report.
- Work findings in the dashboard or Linear, ship fixes, and let Trace retest each one.
The minimum to prepare is repository access and a staging or production URL. Staging is the better choice, because exploitation runs against whichever environment you designate.
Trace vs Strix
Strix is an open-source autonomous pentesting agent under Apache 2.0 with about 67,000 GitHub stars. You install it with one curl command and supply Docker plus an LLM API key.
It works with OpenAI, Anthropic, Google, Bedrock, Azure, or a local model, and it validates findings with proofs-of-concept. It also runs headless in CI with pull-request diff scoping.
Trace is a paid service rather than a tool you operate. The vendor supplies the inference, the sandbox, the OSCP-certified reviewer, and the attestation letter.
The cost models differ in kind. Strix’s CLI is free and its hosted Platform starts at $29 per seat per month, with pentests billed separately per test. Trace charges $4,000 or $12,000 per engagement.
Pick Strix if you want a developer-run agent inside your own pipeline and can review its output yourself.
Pick Trace if an auditor, a customer, or a PCI assessor needs a report with a named tester and a signed letter.
Trace vs RunSybil
RunSybil is an AI-native offensive security platform built around an agent called Sybil. It tests black-box, without source code access.
Sybil explores applications, APIs, cloud, and infrastructure from the outside and chains findings the way an attacker would. The company raised $40M led by Khosla Ventures and lists Cursor and Notion among its customers.
Trace takes the opposite access model. It reads the code, which the vendor argues is how you reach business-logic flaws and cross-tenant gaps that outside probing misses.
Both tools end with exploitation evidence, but from different starting points. RunSybil publishes no pricing and sells through a demo; Trace publishes per-test and per-year tiers plus a downloadable sample report.
Pick RunSybil if you want attacker-style testing on every deployment and cannot share source.
Pick Trace if you can grant read-only repository access and want a scoped engagement at a published price.
Trace vs Darkmoon
Darkmoon is an open-source autonomous pentesting platform under GPL-3.0, maintained by ASC-IT in Toulouse. An orchestrator agent fingerprints the stack and dispatches specialist sub-agents, with 50 agent definitions in the repository.
Darkmoon keeps sensitive values away from the model. The model never executes tools directly, and real IP addresses are swapped for placeholders before a prompt leaves the machine.
Trace runs the models on the vendor side under contractual zero-retention terms, and its agents execute requests against your environment from a sandbox. Enterprise customers can bring their own inference key or deploy self-hosted.
Darkmoon is black-box and self-hosted; Trace is whitebox and vendor-operated by default. Darkmoon reports the request, payload, and response; Trace adds code citations and a human reviewer.
Pick Darkmoon if you need to keep targets and prompts on your own machines and can run the platform yourself.
Pick Trace if you want source-level findings, a compliance-ready report, and someone else operating the tooling.
When should you use Trace?
Trace fits a team that needs a pentest report for SOC 2, ISO 27001, HIPAA, or a customer security review and wants findings that were exploited, not a scanner export.
The vendor’s own framing is AppSec engineers and CISOs who need defensible evidence, and engineering teams who want to fix real issues.
It also fits codebases where the risk sits in authorization logic. IDOR, cross-tenant leaks, and role confusion are hard for a black-box tool to find, and they are what whitebox reading targets.
It is a poor fit if you cannot share source. Trace has no black-box mode.
One-time engagements are also a poor fit for per-commit testing. Continuous testing as code changes is sold separately, at $19,000 or $48,000 a year.
What are alternatives to Trace?
- Strix : open-source Apache 2.0 AI pentest agent you run yourself, with a hosted Platform from $29 per seat.
- RunSybil : black-box AI offensive security that runs on every deployment, no source access needed.
- Darkmoon : GPL-3.0 self-hosted agent platform with a privacy-first execution model.
- Beagle Security : AI-powered pentesting platform for web apps, APIs, and GraphQL with public pricing from $99 per month.
- Bright Security : developer-first DAST built for CI/CD pipelines, with LLM Top 10 coverage.
For the wider field, see the DAST tools hub and the AI pentesting agents research page.
What are Trace’s limitations?
The strengths are easy to check: public pricing, a sample report you can read before a sales call, exploitation evidence per finding, and a named certified reviewer. The limitations below matter as much.
Whitebox access is a hard requirement. If legal, procurement, or a customer contract blocks sharing source with a third party, Trace does not apply.
Exploitation stays inside a safe subset. Four classes are validated live; anything with persistent side effects ships as reviewed analysis without a reproduction artifact, so read the “verified” label per finding.
The homepage says there are no false positives to triage. The terms of service state that AI-generated findings may include false positives, which is the more useful planning assumption.
The terms also put production-testing risk on the customer and recommend staging. Point the environment at staging unless you have a reason not to.
Bitbucket support is Cloud only; Data Center and Server are not supported. The Convex integration stores a full-access deploy key, because Convex offers no read-only credential, and Trace enforces read-only in its own API.
Azure inventory and the in-product audit log are on the roadmap, and log integrations are marked coming soon. If those are gating requirements, ask for dates.
I found no funding details on the vendor site, and no benchmark published or linked by the vendor. Ask for reference calls, not only logos.