
A software vulnerability is a flaw or weakness in code, design, or configuration that an attacker can exploit to gain unauthorized access, steal data, or disrupt services.
Vulnerabilities are cataloged using the CVE (Common Vulnerabilities and Exposures) system maintained by MITRE, scored for severity using CVSS, and classified by weakness type using CWE.
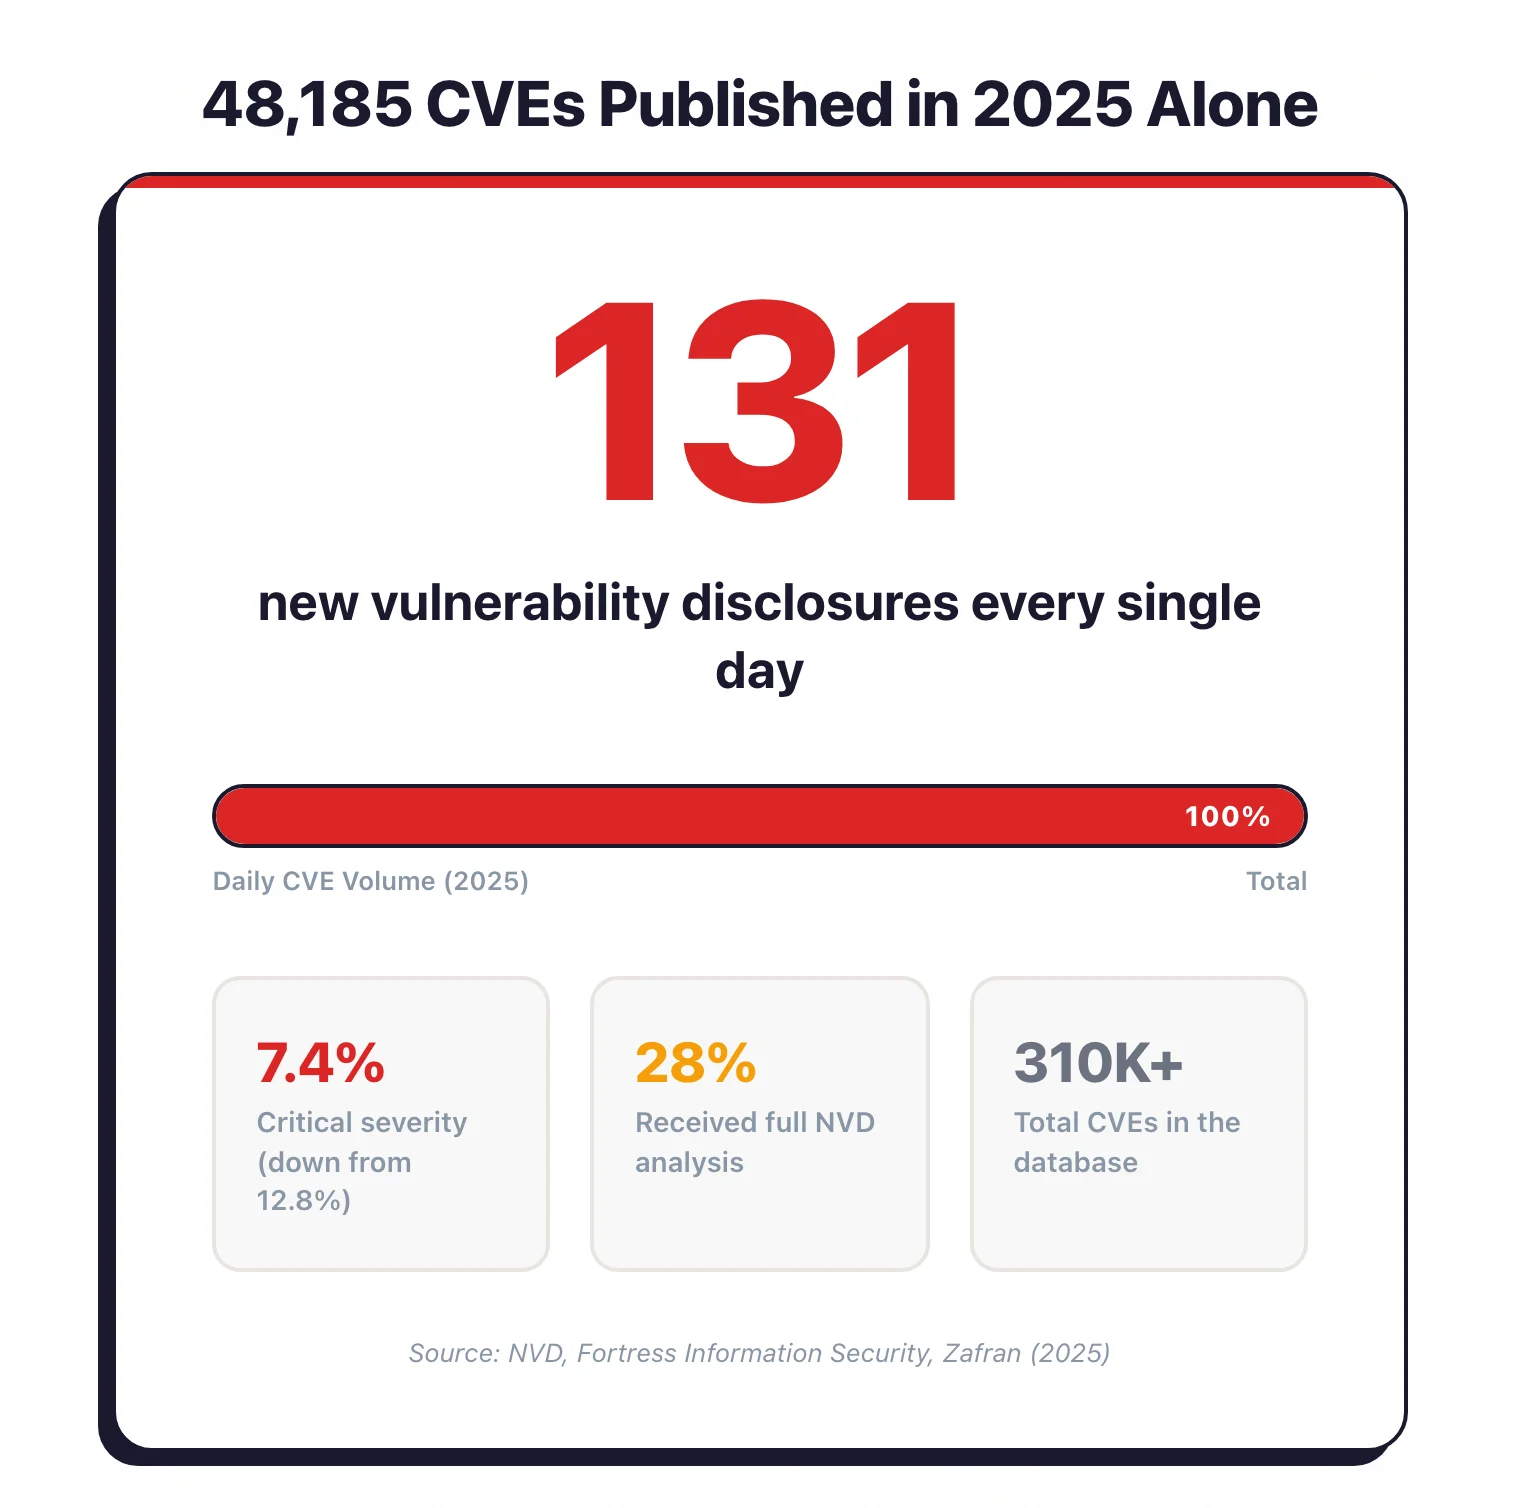
In 2025, over 48,000 new CVEs were published — roughly 131 per day — making vulnerability management one of the most resource-intensive challenges in application security.
This page tracks how fast new vulnerabilities are appearing, how quickly attackers exploit them, and how long it takes organizations to patch them.
I pulled data from 12 industry reports and government databases (NVD, Verizon, IBM, Veracode, Edgescan, and others) published in 2024–2026, supplemented by academic research on exploit prediction and zero-day timelines. I also added findings from three studies I ran myself in early 2026.
Every statistic links to its source. For broader application security data, see my Application Security Statistics page.
Key statistics at a glance#
Pick your next step
I want my own AI-code data
My 2026 study scanning AI-generated code from Copilot, Cursor, and Claude. CWE distribution, false-positive rates, and tool-by-tool detection.
→I want OSS scanner benchmarks
State of open-source AppSec scanners — Semgrep, Trivy, ZAP, Checkov, Gitleaks measured on real repos with reproducible methodology.
→I want a SAST tool now
Every active SAST scanner I track, sorted by language coverage, false-positive rate, and CI/CD fit. Free options first, then commercial.
→CVE disclosure trends#
New vulnerability disclosures keep climbing. The CVE database now holds over 300,000 entries, and 2025 broke every previous record.
How many CVEs were published in 2025?#
- 48,185 CVEs were published in 2025, averaging roughly 131 new disclosures per day — up from ~108/day in 2024 — The Stack 2025
- 40,000+ CVEs were published in 2024, itself a record at the time — CVE Details
- The CVE database surpassed 300,000 total recorded vulnerabilities by December 2025, reaching approximately 310,000 entries — NVD Dashboard
Severity distribution#
- Critical-severity CVEs accounted for 7.4% of all 2025 disclosures, down from 12.8% in 2024 — Zafran 2025
- High-severity CVEs declined to 30% in 2025, down from 35.2% the year before — Zafran 2025
- Despite the lower percentages, the raw count of critical and high-severity CVEs still grew because total volume increased so substantially
NVD analysis backlog#
- Only 28% of newly disclosed CVEs in 2025 received full NVD enrichment (CVSS score, CWE classification, CPE data), down from 46.2% in 2024 — Fortress Information Security
- 54,914 CVEs from 2024–2025 remain in the NVD queue awaiting full analysis — Fortress Information Security
- For organizations that rely on NVD for severity scores, this backlog leaves a blind spot: recent vulnerabilities without CVSS data are harder to prioritize
Most common vulnerability types#
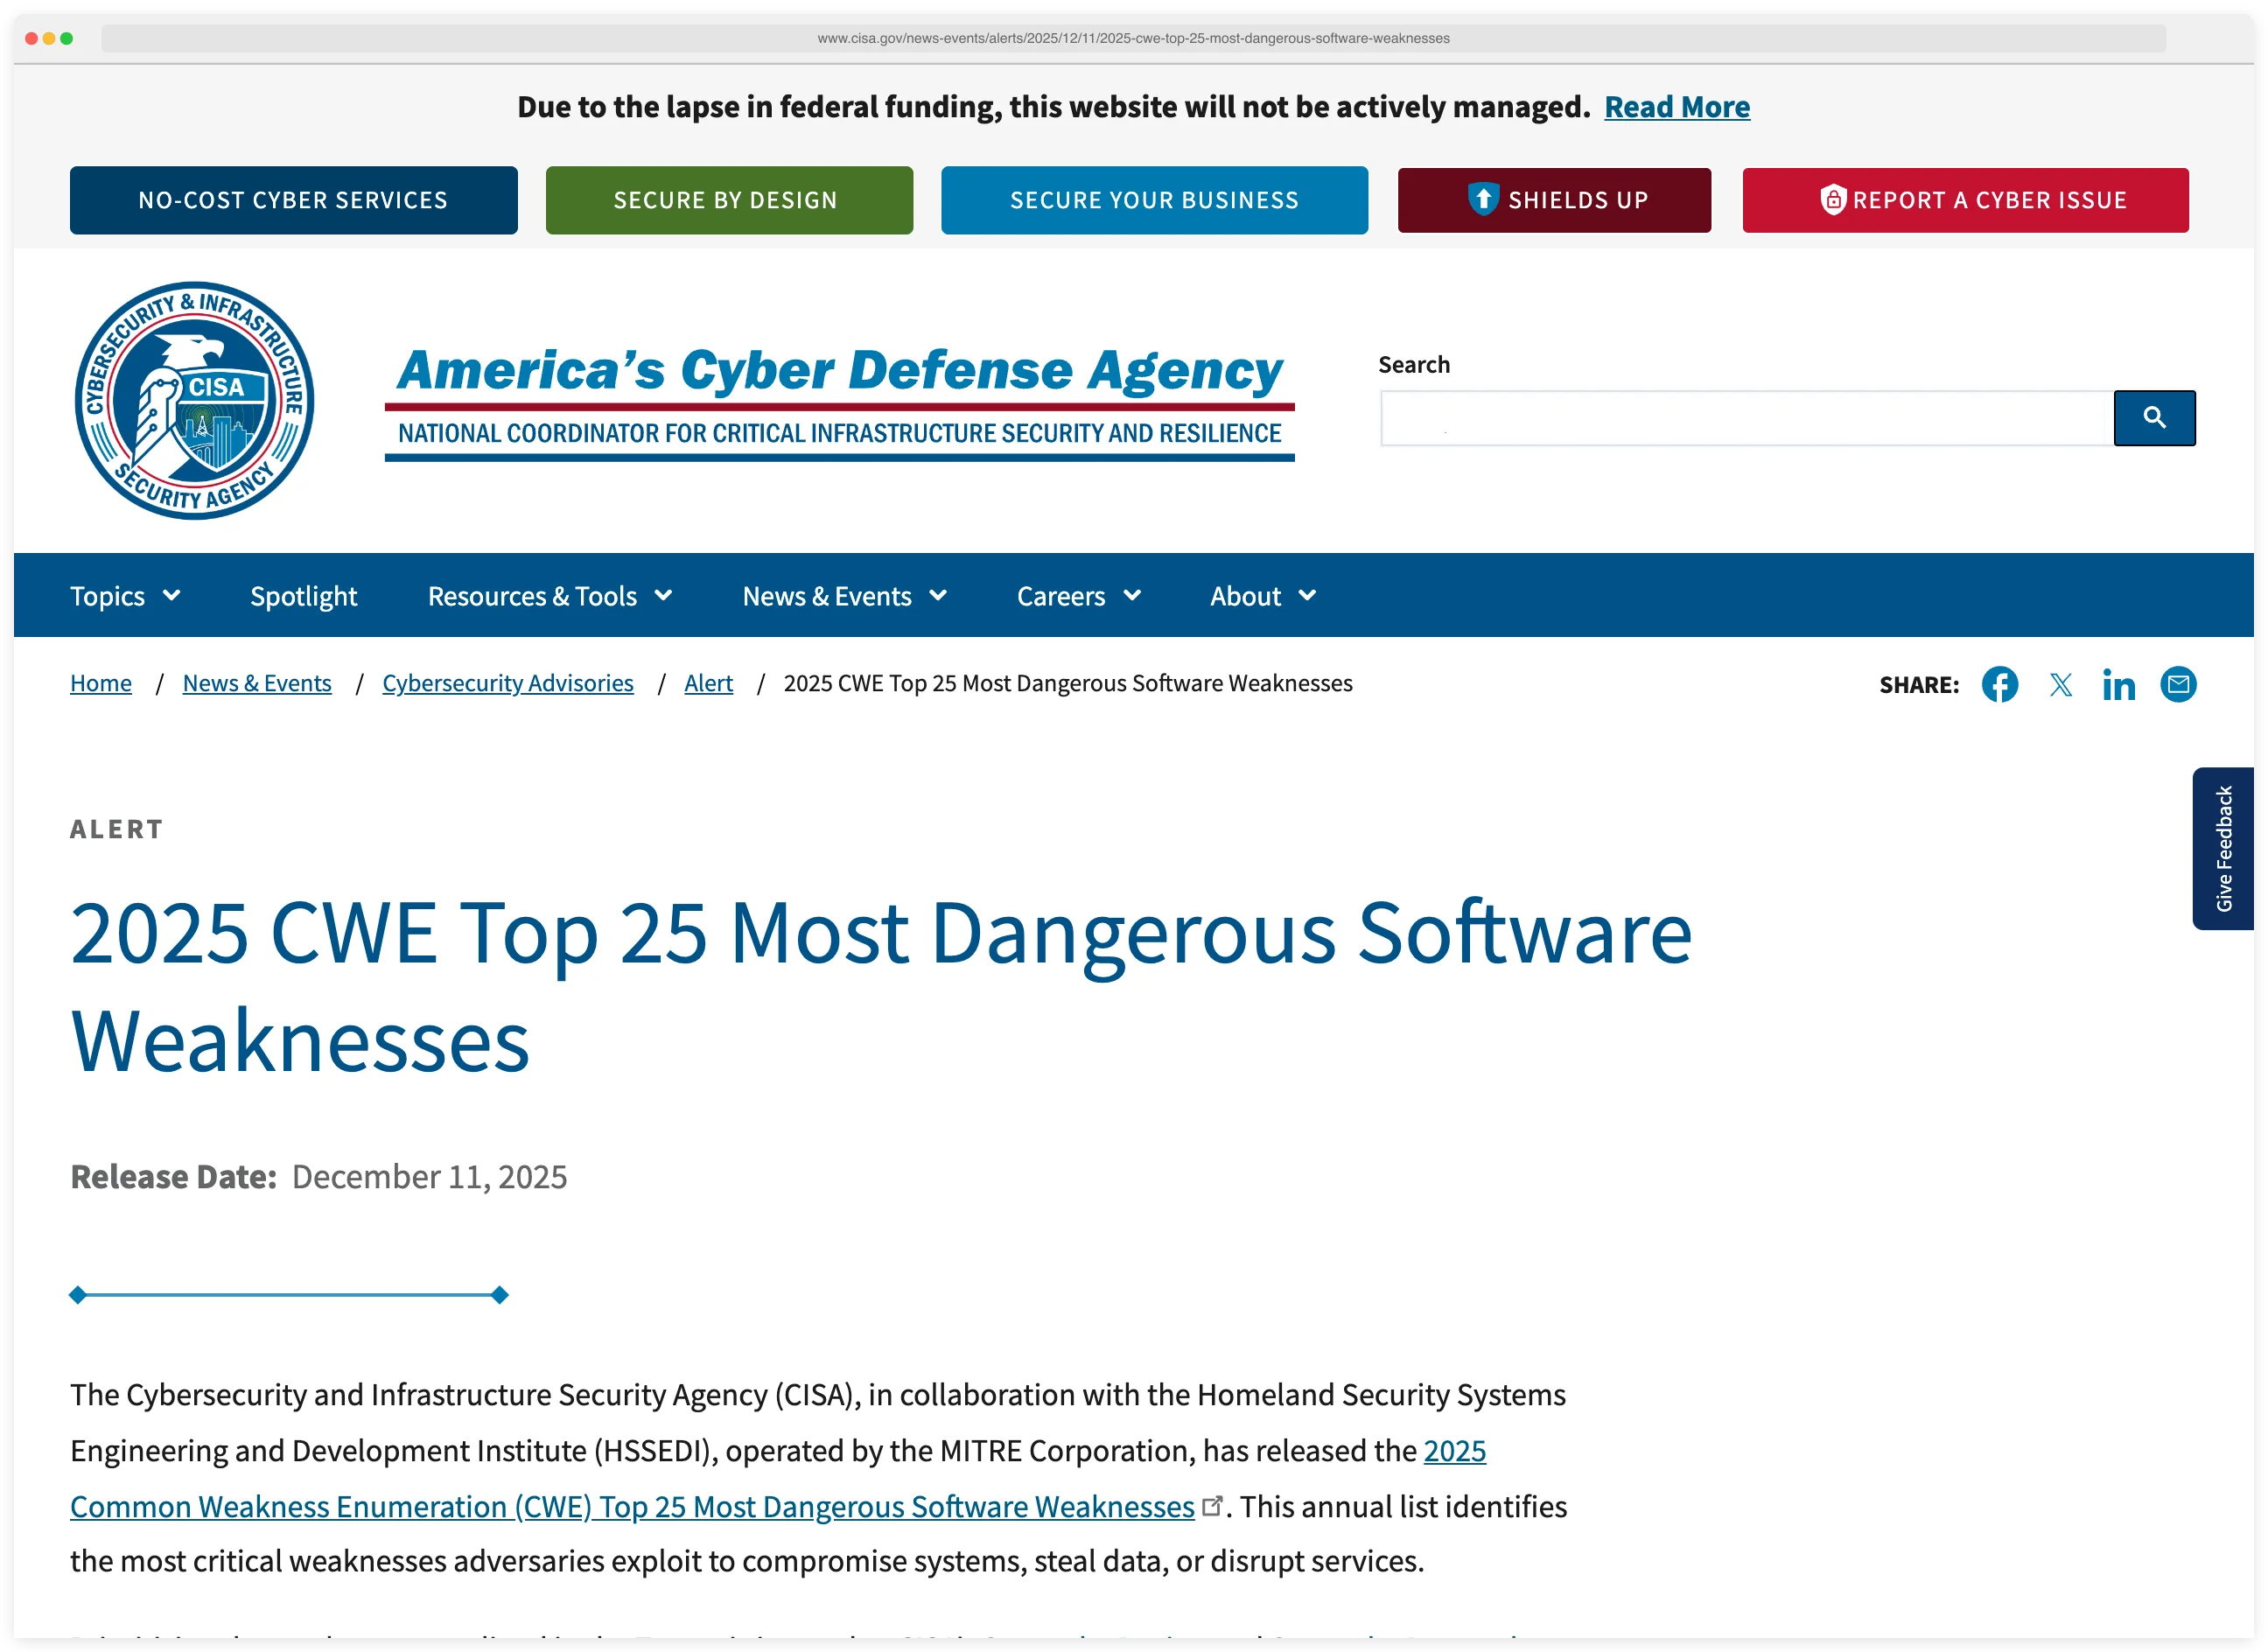
MITRE’s CWE Top 25 identifies the weakness categories behind the largest share of real-world CVEs. The 2025 list analyzed 39,080 CVE records for vulnerabilities reported between June 2024 and June 2025.
CWE Top 25 highlights (2025)#
- Cross-site scripting (CWE-79) holds the #1 position — MITRE CWE Top 25 2025
- SQL injection (CWE-89) moved up to #2 — MITRE CWE Top 25 2025
- Cross-site request forgery (CWE-352) climbed to #3 — MITRE CWE Top 25 2025
- Use-after-free (CWE-416) ranked #7 and code injection (CWE-94) ranked #10, both moving up one spot from 2024 — Infosecurity Magazine 2025
- Six new entries joined the 2025 list including classic buffer overflow, stack-based buffer overflow, heap-based buffer overflow, improper access control, authorization bypass through user-controlled key, and allocation of resources without limits — CISA 2025
CISA KEV weakness types#
- OS command injection (CWE-78) was the most common weakness among vulnerabilities added to CISA’s Known Exploited Vulnerabilities catalog in 2025, appearing in 18 of 245 entries — Cyble 2025
- Deserialization of untrusted data (CWE-502) came second with 14 appearances — Cyble 2025
- Path traversal (CWE-22) moved to third place with 13 entries — Cyble 2025
SAST and DAST scanners catch most of these weakness categories during development. For how the OWASP Top 10 maps to testing in practice, see my vulnerability management lifecycle guide.
Exploitation in the wild#
Disclosure is one thing. What matters to defenders is how fast attackers turn CVEs into working exploits, and how many they actually bother with.
How often are vulnerabilities used in data breaches?#
- Exploitation of vulnerabilities accounted for 20% of all breaches in 2025, making it the second most common initial access vector after credential abuse — Verizon DBIR 2025
- This represents a 34% year-over-year increase in vulnerability exploitation as a breach vector — Verizon DBIR 2025
- In espionage-motivated breaches, vulnerability exploitation as an initial access vector jumped to 70% — Verizon DBIR 2025
How fast are vulnerabilities exploited after disclosure?#
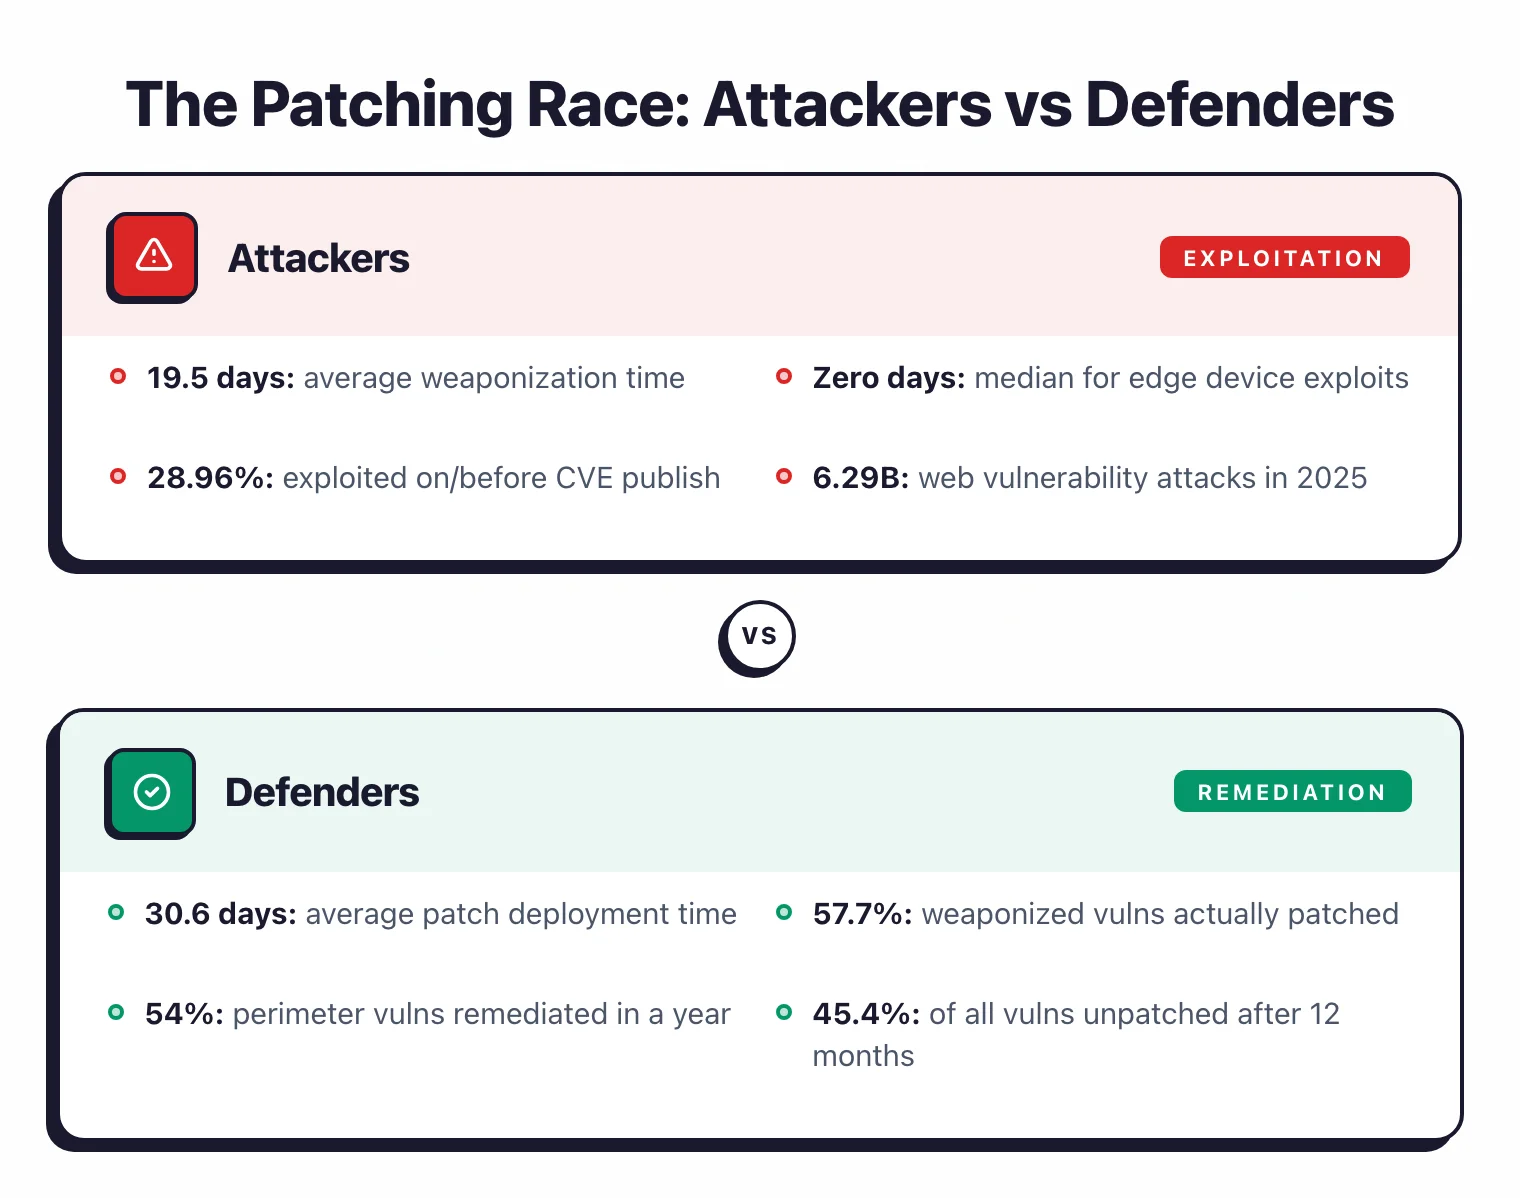
- 28.96% of vulnerabilities added to CISA’s KEV catalog in 2025 were exploited on or before the day their CVE was published, up from 23.6% in 2024 — VulnCheck 2026
- For critical edge-device vulnerabilities (firewalls, VPN gateways), the median time between disclosure and mass exploitation was zero days — Verizon DBIR 2025
- Attackers weaponize vulnerabilities in an average of 19.5 days, while organizations average 30.6 days to deploy patches — creating an 11-day exposure window — Qualys TruRisk 2023
- Attacks targeting website vulnerabilities reached 6.29 billion in 2025, up 56% from 4 billion in 2024 — Indusface 2026
CISA KEV catalog#
- The CISA KEV catalog grew to 1,484 entries by end of 2025, up from 1,239 at end of 2024 — a nearly 20% increase — Cyble 2025
- CISA added 245 vulnerabilities in 2025, a 30%+ increase over the trend seen in 2023 and 2024 — The Cyber Express 2025
- 304 of 1,484 KEV entries (20.5%) have been exploited by ransomware groups — Cyble 2025
- Microsoft led all vendors with 39 KEV additions in 2025, up from 36 in 2024 — Cyble 2025
Edge device targeting#
- 22% of all vulnerability exploitation breaches in 2025 targeted edge infrastructure (firewalls, VPN concentrators, remote access gateways) — Verizon DBIR 2025
- This represents an eightfold increase compared to the previous year — Verizon DBIR 2025
- Only 54% of perimeter-device vulnerabilities were fully remediated within the year — Verizon DBIR 2025
Zero-day exploitation#
Zero-days are the flaws exploited before a patch exists. Google’s Threat Intelligence Group (GTIG) tracks these more comprehensively than anyone else.
2025 zero-day landscape#
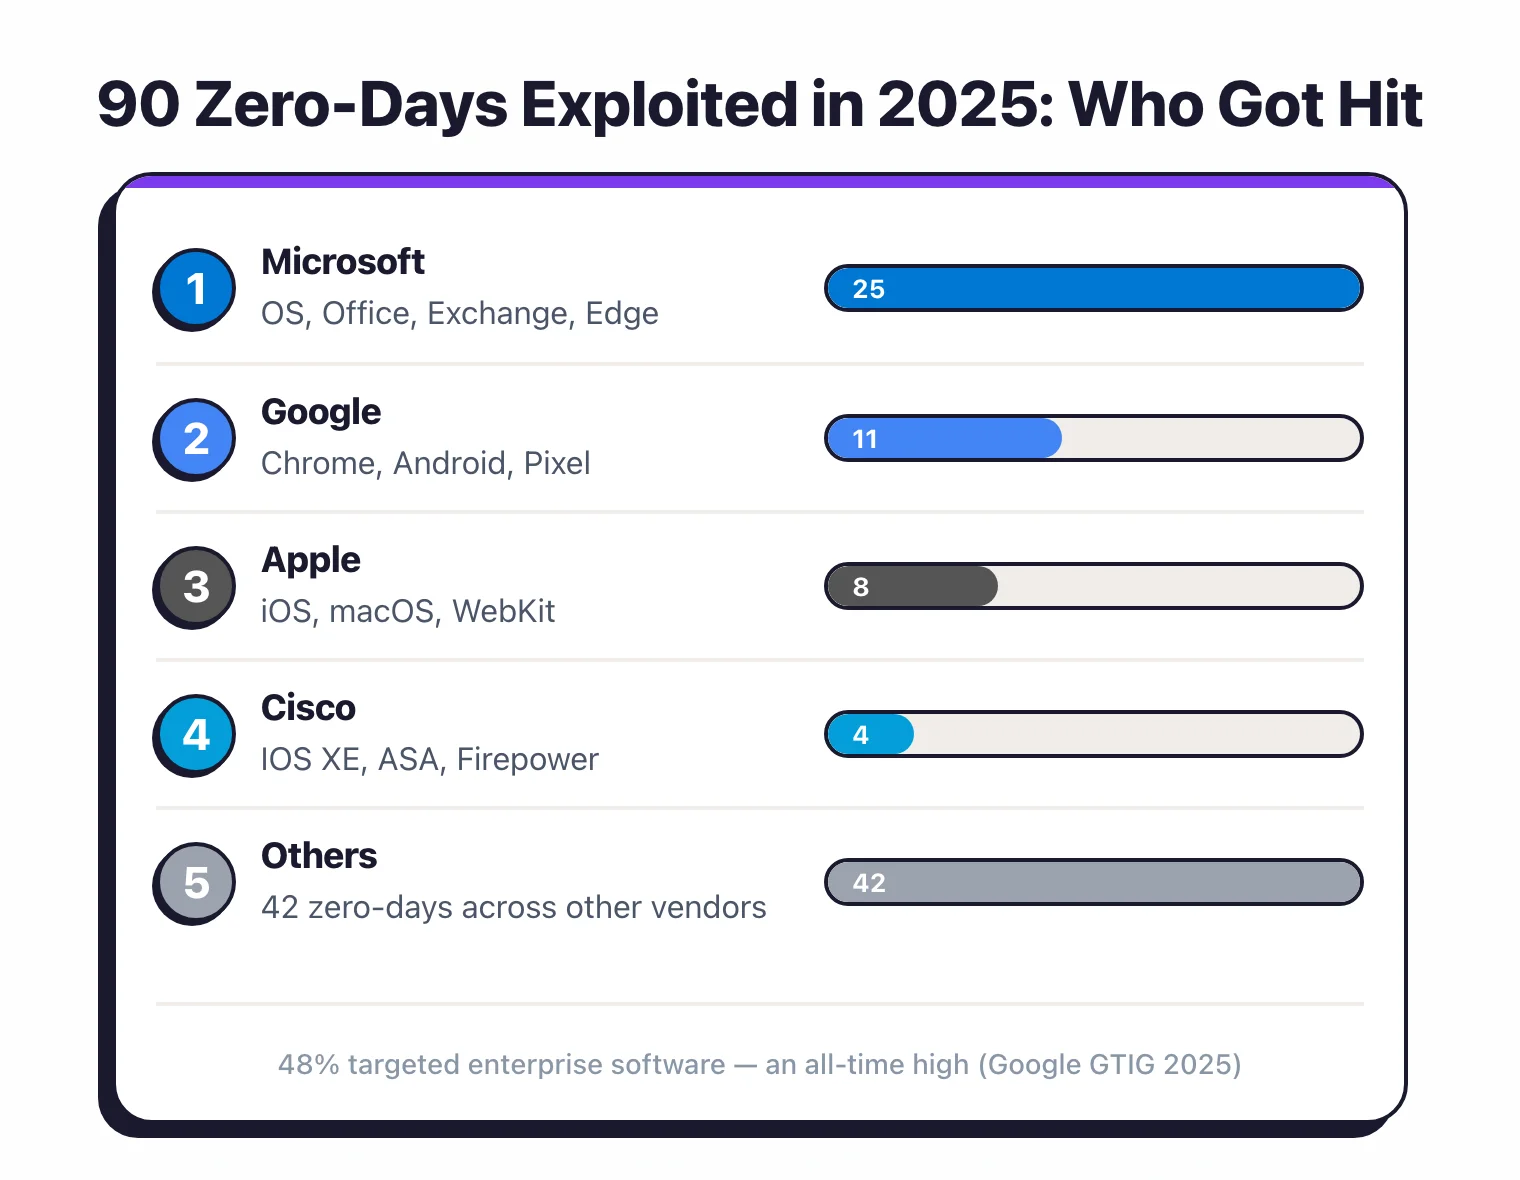
- Google GTIG tracked 90 zero-day vulnerabilities exploited in the wild in 2025, up from 78 in 2024 and within the 60–100 range established over four years — Google Cloud Blog 2025
- 43 zero-days (48%) targeted enterprise software and appliances — both the raw number and proportion reached all-time highs — Google Cloud Blog 2025
- Browser-based exploitation fell to historical lows, while operating system vulnerabilities saw increased abuse — Google Cloud Blog 2025
- Microsoft accounted for 25 of the 90 zero-days, followed by Google (11), Apple (8), and Cisco (4) — SecurityWeek 2025
Threat actors#
- Commercial surveillance vendors (CSVs) were the most active users of zero-day exploits in 2025, surpassing traditional state-sponsored espionage groups for the first time — Google Cloud Blog 2025
- Ransomware attacks rose 37% year-over-year and were present in 44% of breaches — Verizon DBIR 2025
- 24 vulnerabilities added to CISA KEV in 2025 were marked as exploited by ransomware groups specifically — Cyble 2025
Academic research backs this up. Jacobs et al. (2023) built an exploit prediction system using input from 170+ experts and achieved 82% better accuracy than older models at predicting which vulnerabilities would actually get weaponized.
The implication: the same signals attackers rely on could help defenders prioritize, too.
Remediation timelines#
Discovering a vulnerability is the easy part. Fixing it before someone exploits it is where most organizations struggle. Fix times are getting longer on average, but the best-performing teams show it doesn’t have to be that way.
How long does it take to fix a vulnerability?#
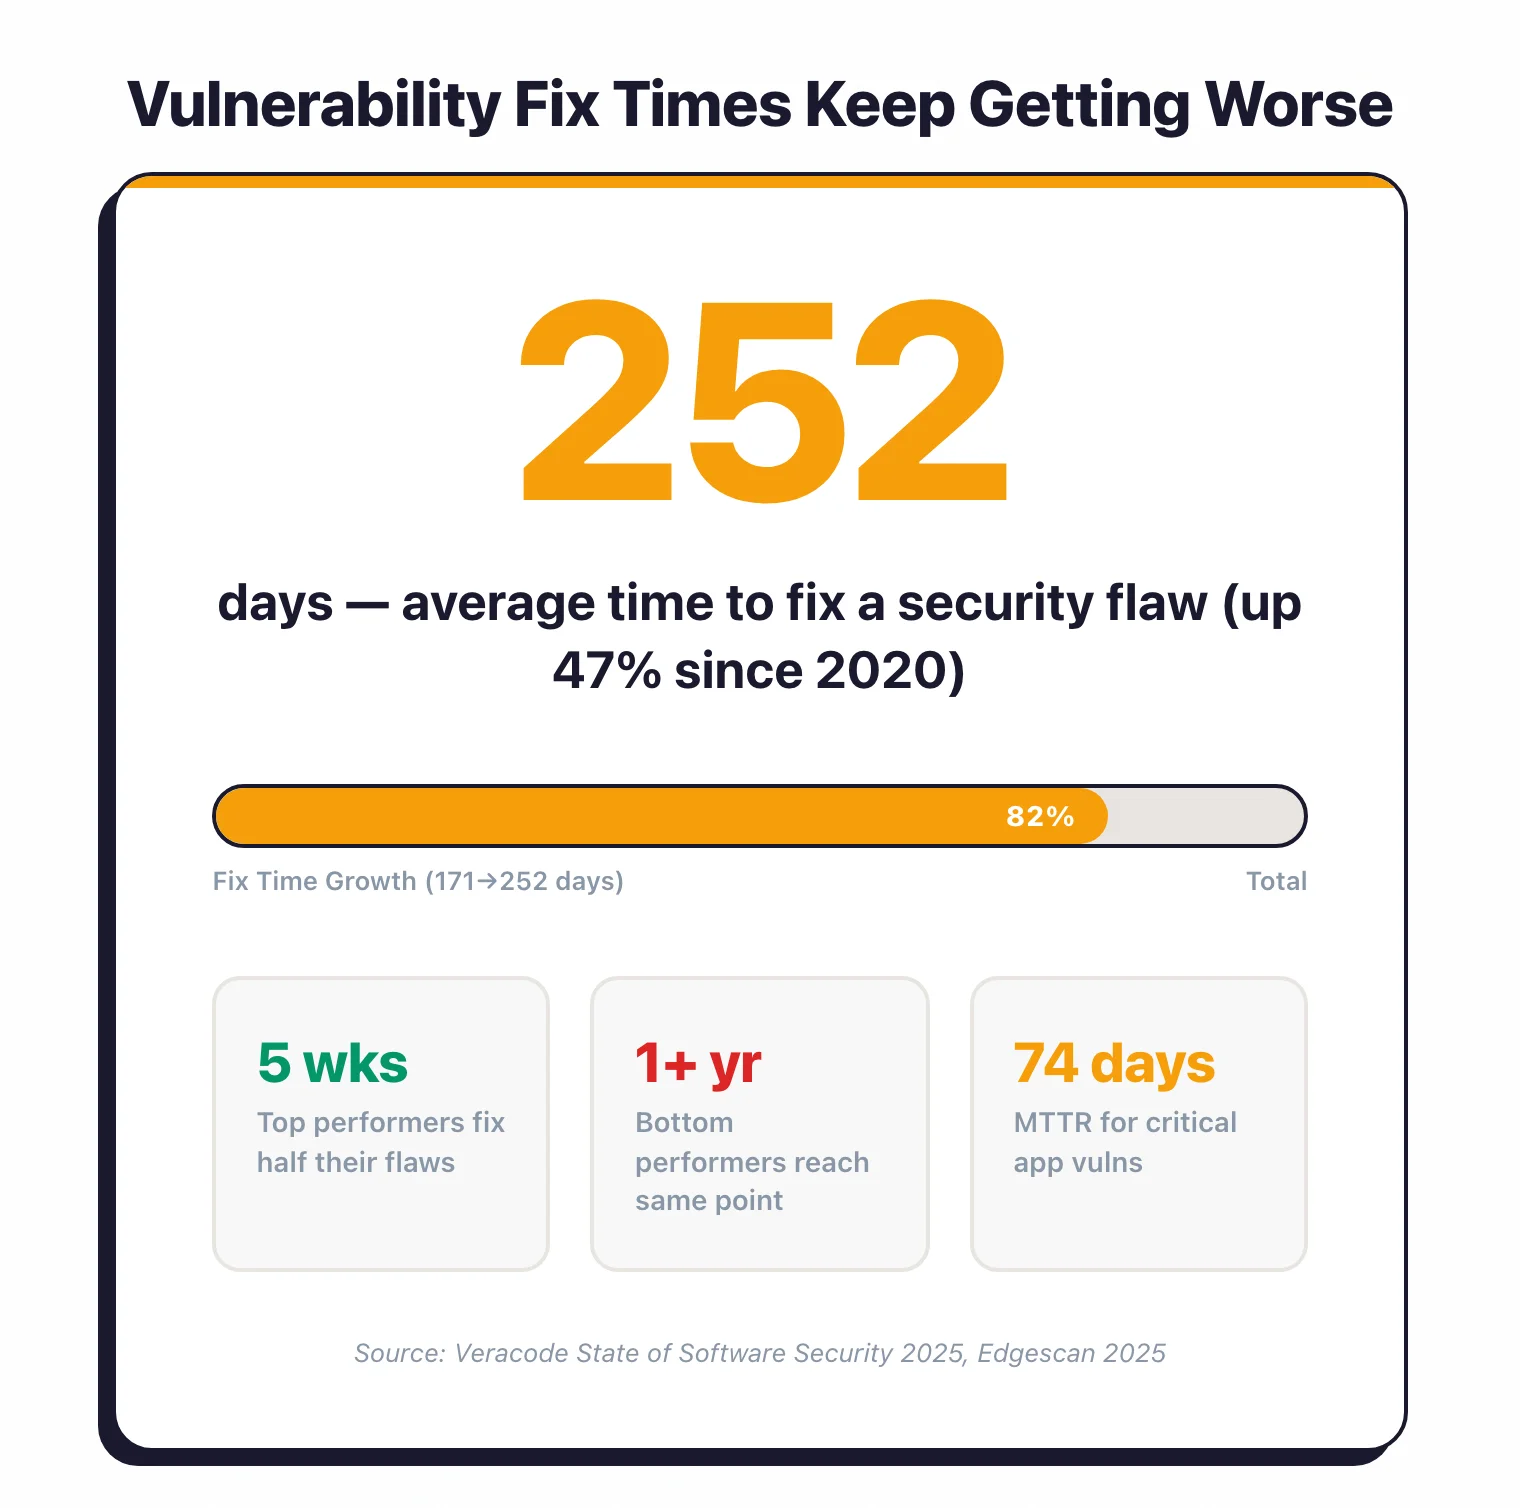
- The average time to fix a security flaw has increased 47% since 2020, rising from 171 days to 252 days — Veracode 2025
- Critical application vulnerabilities take an average of 74.3 days to remediate — Edgescan 2025
- Internet-facing critical vulnerabilities are fixed faster at 35 days, while host/cloud critical vulnerabilities average 61 days — Edgescan 2025
- Perimeter-device vulnerabilities take a median of 32 days to patch — Verizon DBIR 2025
- Windows and Chrome vulnerabilities are patched in 17.4 days on average — roughly twice as fast as other applications — Qualys TruRisk 2023
What percentage of vulnerabilities go unpatched?#
- 45.4% of enterprise vulnerabilities remain unpatched after 12 months, with 17.4% being high or critical severity — Edgescan 2025
- Weaponized vulnerabilities are patched only 57.7% of the time — Qualys TruRisk 2023
- A 2019 Ponemon/ServiceNow study found that 60% of breaches involved exploiting known vulnerabilities where a patch was already available — a trend consistent with Verizon DBIR’s ongoing finding that patching delays remain a top risk factor — Ponemon 2019
- Only 54% of perimeter-device vulnerabilities were fully remediated within the year — Verizon DBIR 2025
Maturity gap#
- Top-performing organizations resolve over 10% of their flaws monthly and remediate half within 5 weeks — Veracode 2025
- Lower-performing organizations address less than 1% of flaws monthly and take over a year to reach the same milestone — Veracode 2025
- Leading organizations have flaws in fewer than 43% of applications, while lagging organizations exceed 86% — Veracode 2025
- Software companies achieve the fastest MTTR at 63 days, while the construction sector lags at 104 days — Edgescan 2025
First-party vs third-party flaws#
Most modern applications contain more dependency code than original code. That shifts the vulnerability math: your risk profile is largely shaped by libraries you didn’t write.
Open-source and supply chain exposure#
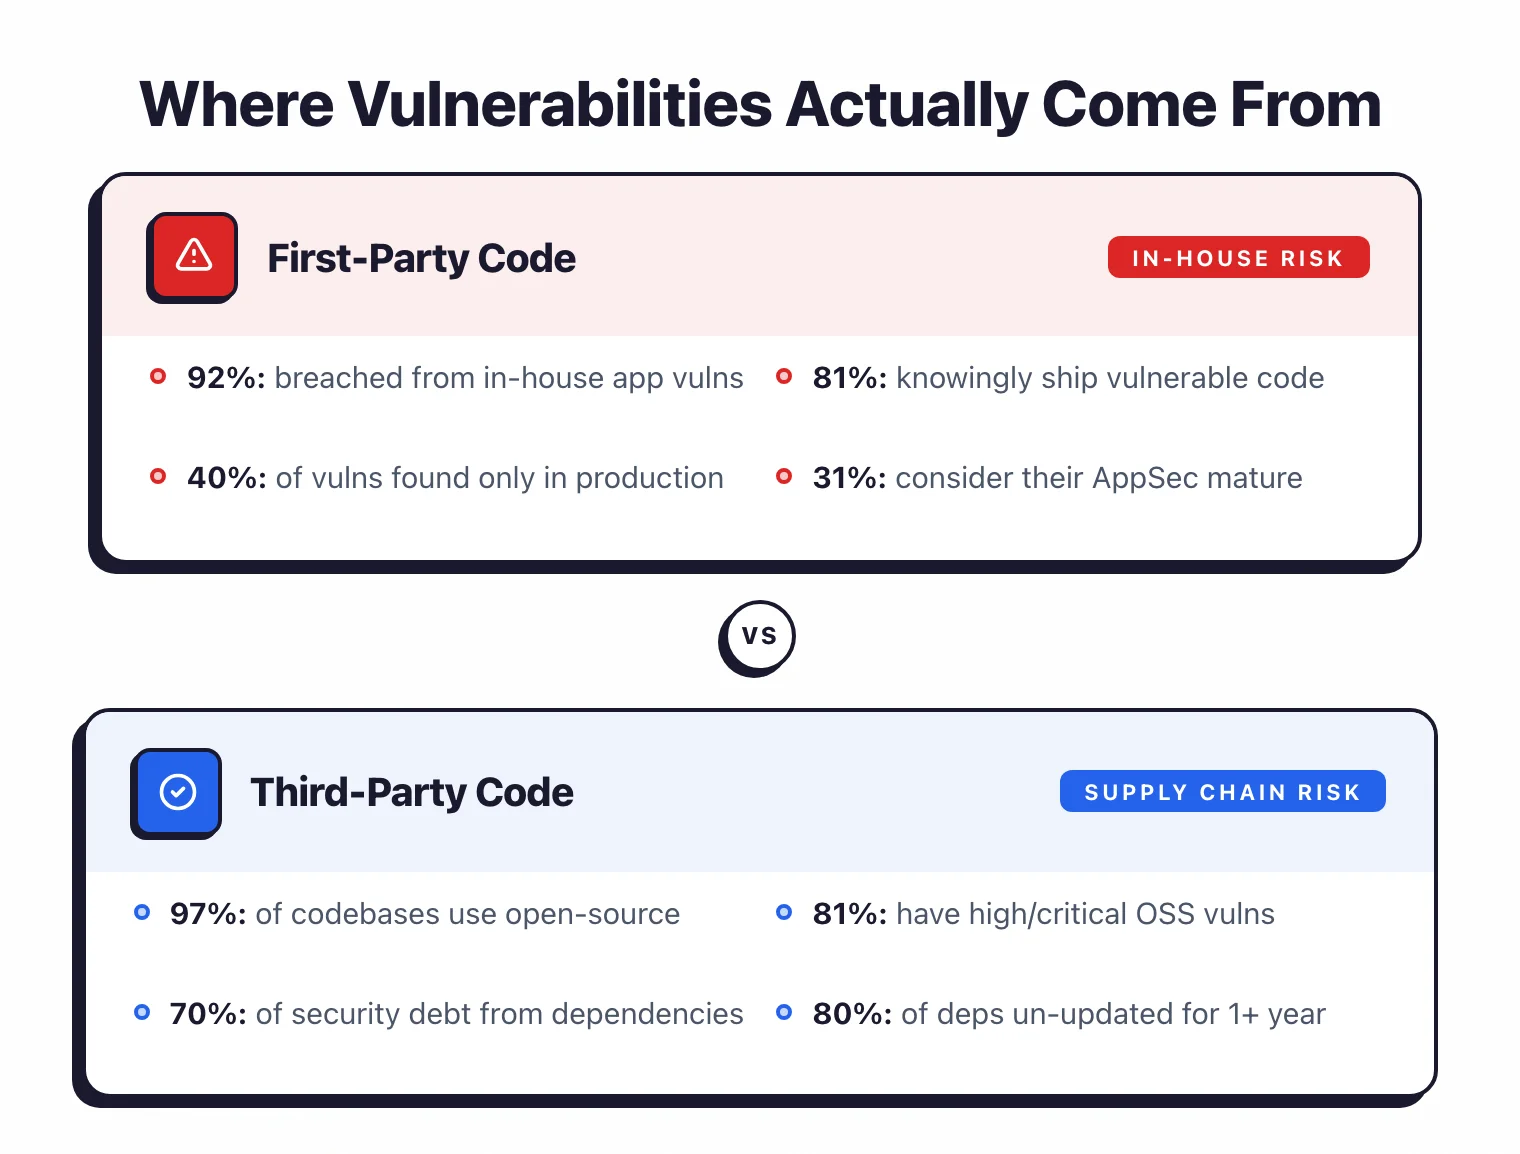
- 97% of commercial codebases contain open-source components — Black Duck OSSRA 2025
- 81% of those codebases have at least one high- or critical-risk open-source vulnerability — Black Duck OSSRA 2025
- 80% of application dependencies remain un-updated for over a year — Sonatype 2024
- 70% of accumulated security debt originates from third-party library flaws — Veracode 2025
In-house application vulnerabilities#
- 92% of companies surveyed experienced a breach in the prior year due to vulnerabilities in applications developed in-house — Checkmarx Global Pulse on AppSec 2024 (survey of 1,504 respondents)
- 81% of organizations admitted to knowingly shipping code with vulnerabilities, up from two-thirds in 2024 — Checkmarx Future of AppSec 2025
- 60% of vulnerabilities are detected during code, build, or test phases, while 40% are found in production — Checkmarx Future of AppSec 2025
- Only 31% of CISOs and AppSec managers consider their security program highly mature — Checkmarx Future of AppSec 2025
Third-party breach impact#
- Third-party involvement in breaches has doubled to 30% — Verizon DBIR 2025
- 50% of organizations carry critical security debt, defined as unresolved high-exploitability vulnerabilities lingering for years — Veracode 2025
- Less than 17% of applications in leading organizations carry security debt, compared with over 67% in lagging organizations — Veracode 2025
For tools that track open-source risk, see my SCA tools comparison . For first-party code scanning, see SAST tools and DAST tools .
Cost of vulnerabilities#
When vulnerabilities get exploited, the bill arrives. These numbers tend to get executives’ attention faster than any CVSS score.

How much does a data breach cost?#
- The global average cost of a data breach fell to $4.44 million in 2025, down 9% from $4.88 million in 2024 — the first decline in five years — IBM 2025
- US breach costs reached a record high of $10.22 million, up 9% year-over-year and roughly 2.3x the global average — IBM 2025
- Healthcare remained the most expensive industry at $7.42 million per breach, though down $2.35 million from 2024 — IBM 2025
- Extortion and ransomware incidents disclosed publicly by the attacker cost an average of $5.08 million — IBM 2025
- One in five organizations (20%) suffered a breach involving shadow AI — unsanctioned AI tools added an average of $670,000 to breach costs — IBM 2025
Detection and containment#
- The global average breach lifecycle dropped to 241 days in 2025, a 17-day reduction from 2024’s 258 days and the lowest level in nearly a decade — IBM 2025
- Healthcare breaches took 279 days to identify and contain — more than five weeks longer than the global average — IBM 2025
- Organizations that detected breaches internally saved an average of $900,000 compared to those whose attackers disclosed the breach first — IBM 2025
Cost reduction through security investment#
- Extensive use of security AI and automation saved organizations an average of $1.9 million per breach and cut the breach lifecycle by 80 days — IBM 2025
- 63% of ransomware victims refused to pay in 2025, up from 59% the prior year — IBM 2025
- 16% of breaches involved attackers using AI tools, most commonly for phishing and deepfake impersonation — IBM 2025
The AI governance gap#
- 13% of organizations suffered an AI-related security breach in 2025, with another 8% uncertain whether they had — IBM 2025
- 97% of AI-breached organizations lacked proper access controls on their AI systems — IBM 2025
- 63% of organizations had no AI governance policies at all, and only 34% of those with policies performed regular AI audits — IBM 2025
My own research#
I ran three original studies in early 2026 that produced vulnerability data worth noting here.
AI-generated code security#
I tested 522 code samples from six LLMs and found a 25.7% vulnerability rate — meaning roughly one in four AI-generated code snippets contained a confirmed security flaw. The most common weaknesses were CWE-918 (SSRF) at 32 findings and CWE-22/23 (path traversal) at 30. Full findings: AI-Generated Code Security Study 2026 .
Security headers adoption#
I scanned 10,000 websites and found that only 27.3% deploy a Content-Security-Policy header, and just 11.2% achieve an A+ grade using Mozilla Observatory methodology. The median security header grade was D. Full findings: Security Headers Adoption Study 2026 .
Open source AppSec tool health#
I evaluated 100+ open-source security tools across 10 categories using a composite health score (stars, contributors, release frequency, issue response, downloads). Four projects scored below 30/100, indicating risk of abandonment. Full findings: State of Open Source AppSec Tools 2026 .
Sources & methodology#
Every number on this page links to a published report, government database, or academic paper. If I cannot trace a statistic to a primary source, I do not include it.
Government and standards databases:
- NVD Dashboard — U.S. National Vulnerability Database, maintained by NIST
- CISA Known Exploited Vulnerabilities Catalog — actively exploited vulnerabilities requiring federal remediation
- MITRE CWE Top 25 2025 — analysis of 39,080 CVE records (Jun 2024–Jun 2025)
Industry reports:
- IBM Cost of a Data Breach Report 2025 — annual IBM/Ponemon study covering 600+ breached organizations across 17 industries and 16 countries
- Verizon 2025 DBIR — analysis of 22,052 security incidents including 12,195 confirmed breaches
- Veracode State of Software Security 2025 — analysis of 1.3 million application scans
- Edgescan Vulnerability Statistics Report 2025 — 10th edition, based on thousands of enterprise assessments
- Black Duck OSSRA Report 2025 — audit of 1,000+ commercial codebases
- Sonatype State of the Software Supply Chain 2024 — tracking of 7 million+ open-source projects
- Google GTIG Zero-Day Analysis 2025 — comprehensive tracking of in-the-wild zero-day exploitation
- VulnCheck State of Exploitation 2026 — KEV exploitation timing analysis
- Checkmarx Global Pulse on Application Security 2024 — survey of 1,504 security professionals
- Checkmarx Future of Application Security 2025 — survey of 1,500+ security professionals (2026 outlook edition)
- Qualys TruRisk Research Report 2023 — weaponization and patch timing analysis
Academic research:
- Jacobs, J. et al. (2023) — “Enhancing Vulnerability Prioritization: Data-Driven Exploit Predictions with Community-Driven Insights” — data-driven exploit scoring leveraging 170+ expert assessments, achieving 82% prediction improvement
- Fortress Information Security — NVD Analysis Report — tracking NVD enrichment backlog and analysis capacity
Original research (AppSec Santa):
- AI-Generated Code Security Study 2026 — 522 code samples from 6 LLMs, 5 SAST tools
- Security Headers Adoption Study 2026 — 10,000 websites scanned for header adoption
- State of Open Source AppSec Tools 2026 — 100+ tools evaluated across 10 categories