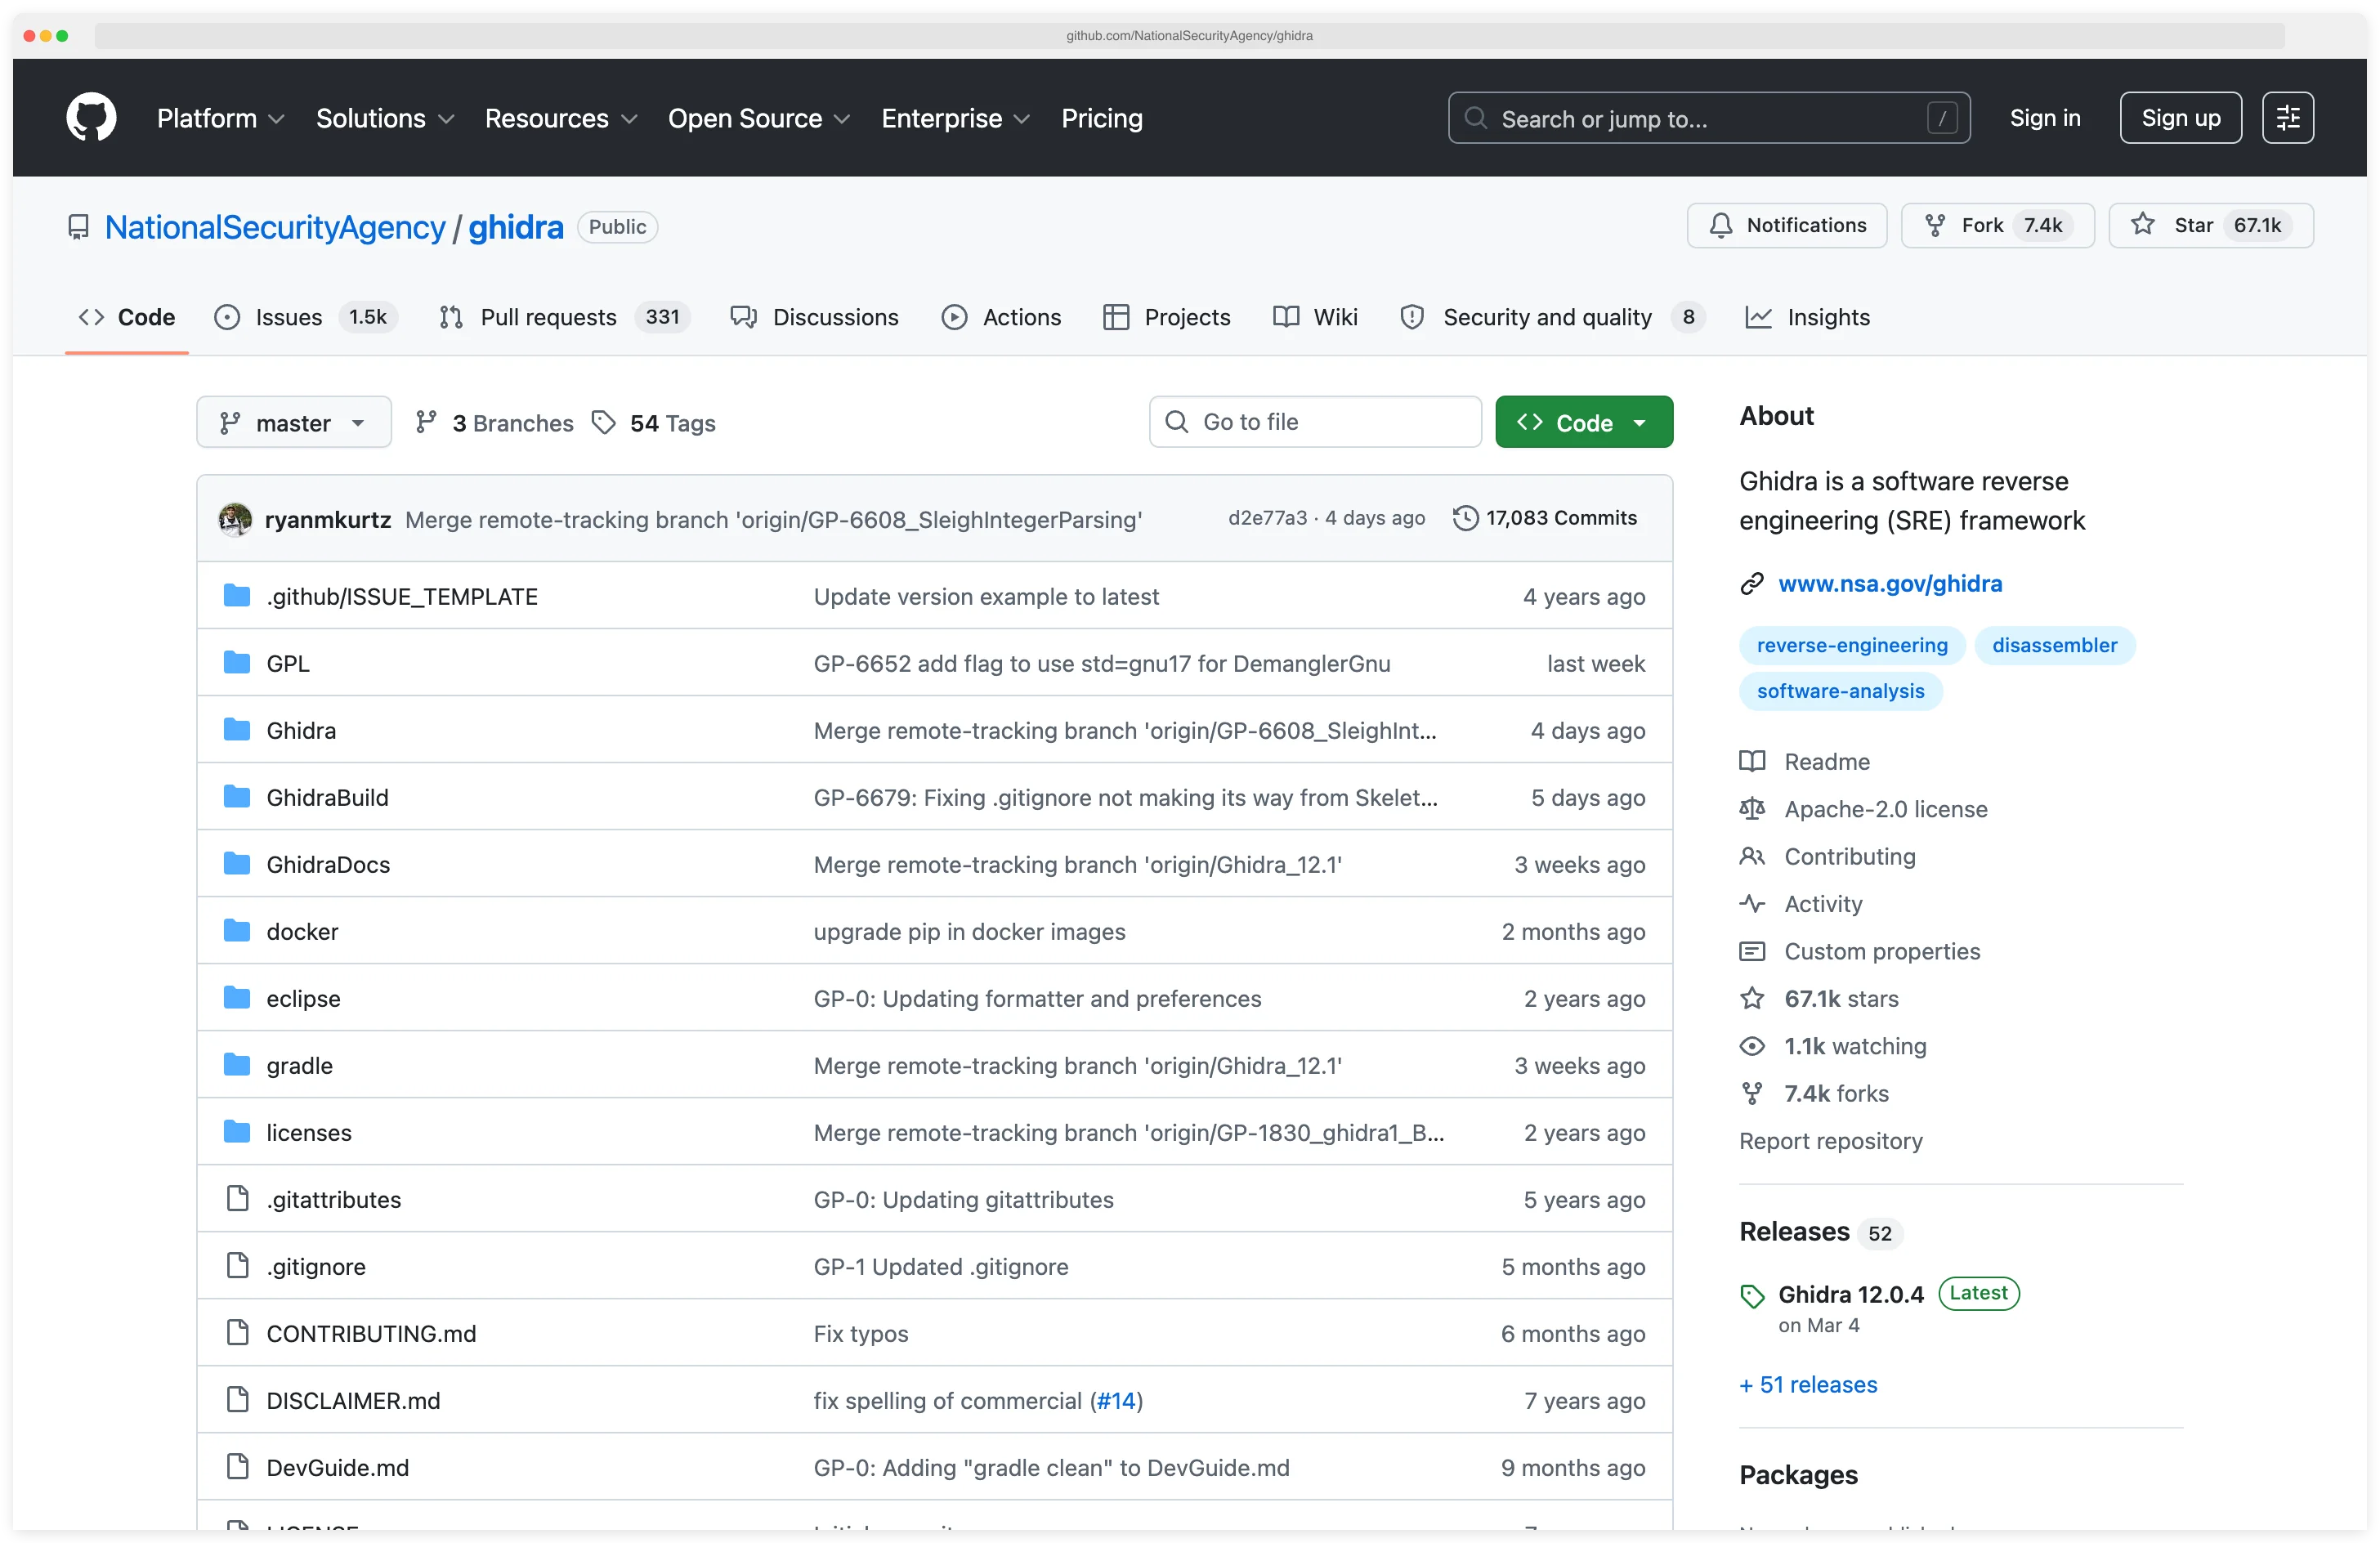
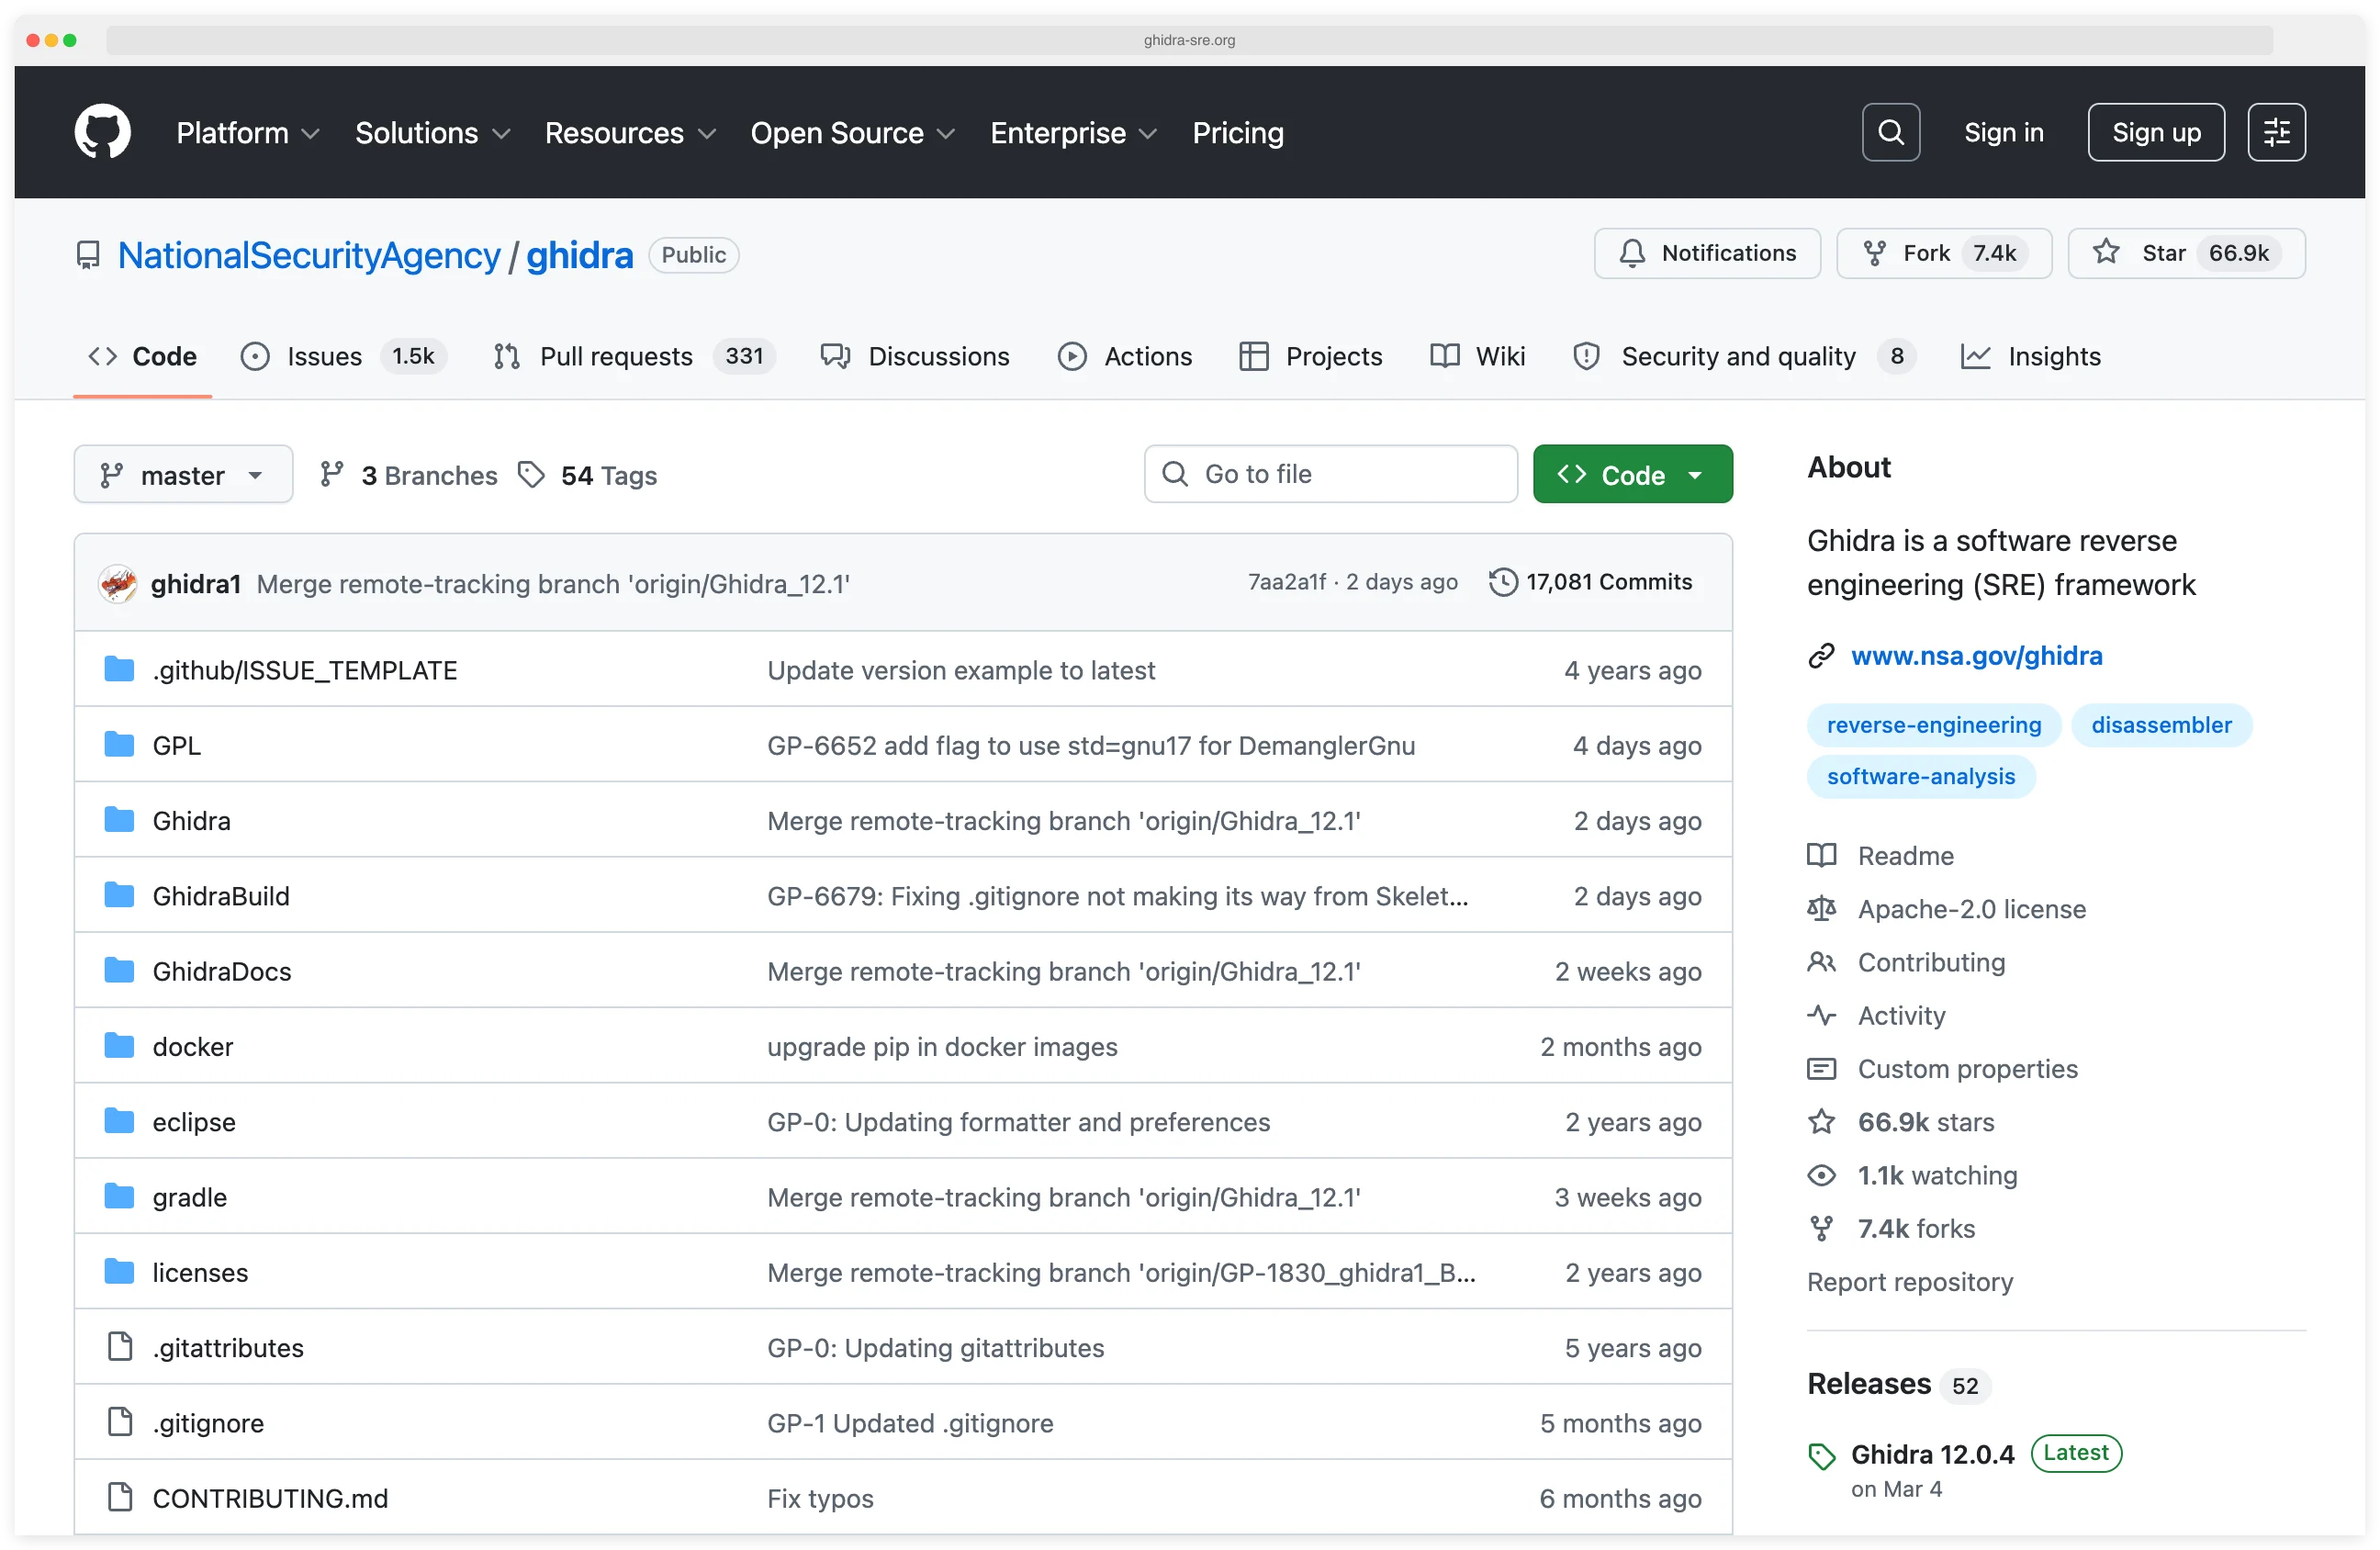
Ghidra is a free, open-source software reverse engineering framework built by the US National Security Agency and released publicly in March 2019 at the RSA Conference.
It disassembles and decompiles compiled binaries across x86, ARM, MIPS, PowerPC, and dozens more architectures. With over 69,859 GitHub stars, it is the most-used open-source alternative to IDA Pro.
The framework is distributed under the Apache License 2.0, runs locally on Windows, macOS, and Linux, and ships with a scriptable decompiler, integrated debugger, and collaborative server.
The NSA developed Ghidra over decades for internal use before making it available to the public. That background shows up in its analysis algorithms, architecture coverage, and collaborative features.
Version 11.3, released in 2025, added kernel-level debugging, JIT p-code emulation, Visual Studio Code integration, and new function graph layouts.
Note: Some older Ghidra tutorials predate the 11.3 integrated debugger. If you follow a 2023 guide and can't find the Debugger menu, you're probably on 10.x — upgrade before troubleshooting.
I open Ghidra when I need to reverse a stripped binary and the project is too large for a quick look in radare2. The decompiler turns unfamiliar assembly into pseudo-C that I can annotate, and the scripting API in Python or Java lets me automate repetitive patching across a batch of binaries. It is free, maintained by the NSA, and the only open-source reverse-engineering suite that feels close to IDA Pro.
What is Ghidra?
Ghidra is a software reverse engineering suite, developed by the NSA and released in 2019, that disassembles and decompiles compiled binaries into human-readable C-like pseudocode. Ghidra analyzes executables across Windows, macOS, Linux, Android, iOS, and embedded systems without sending any data off the analyst’s machine.
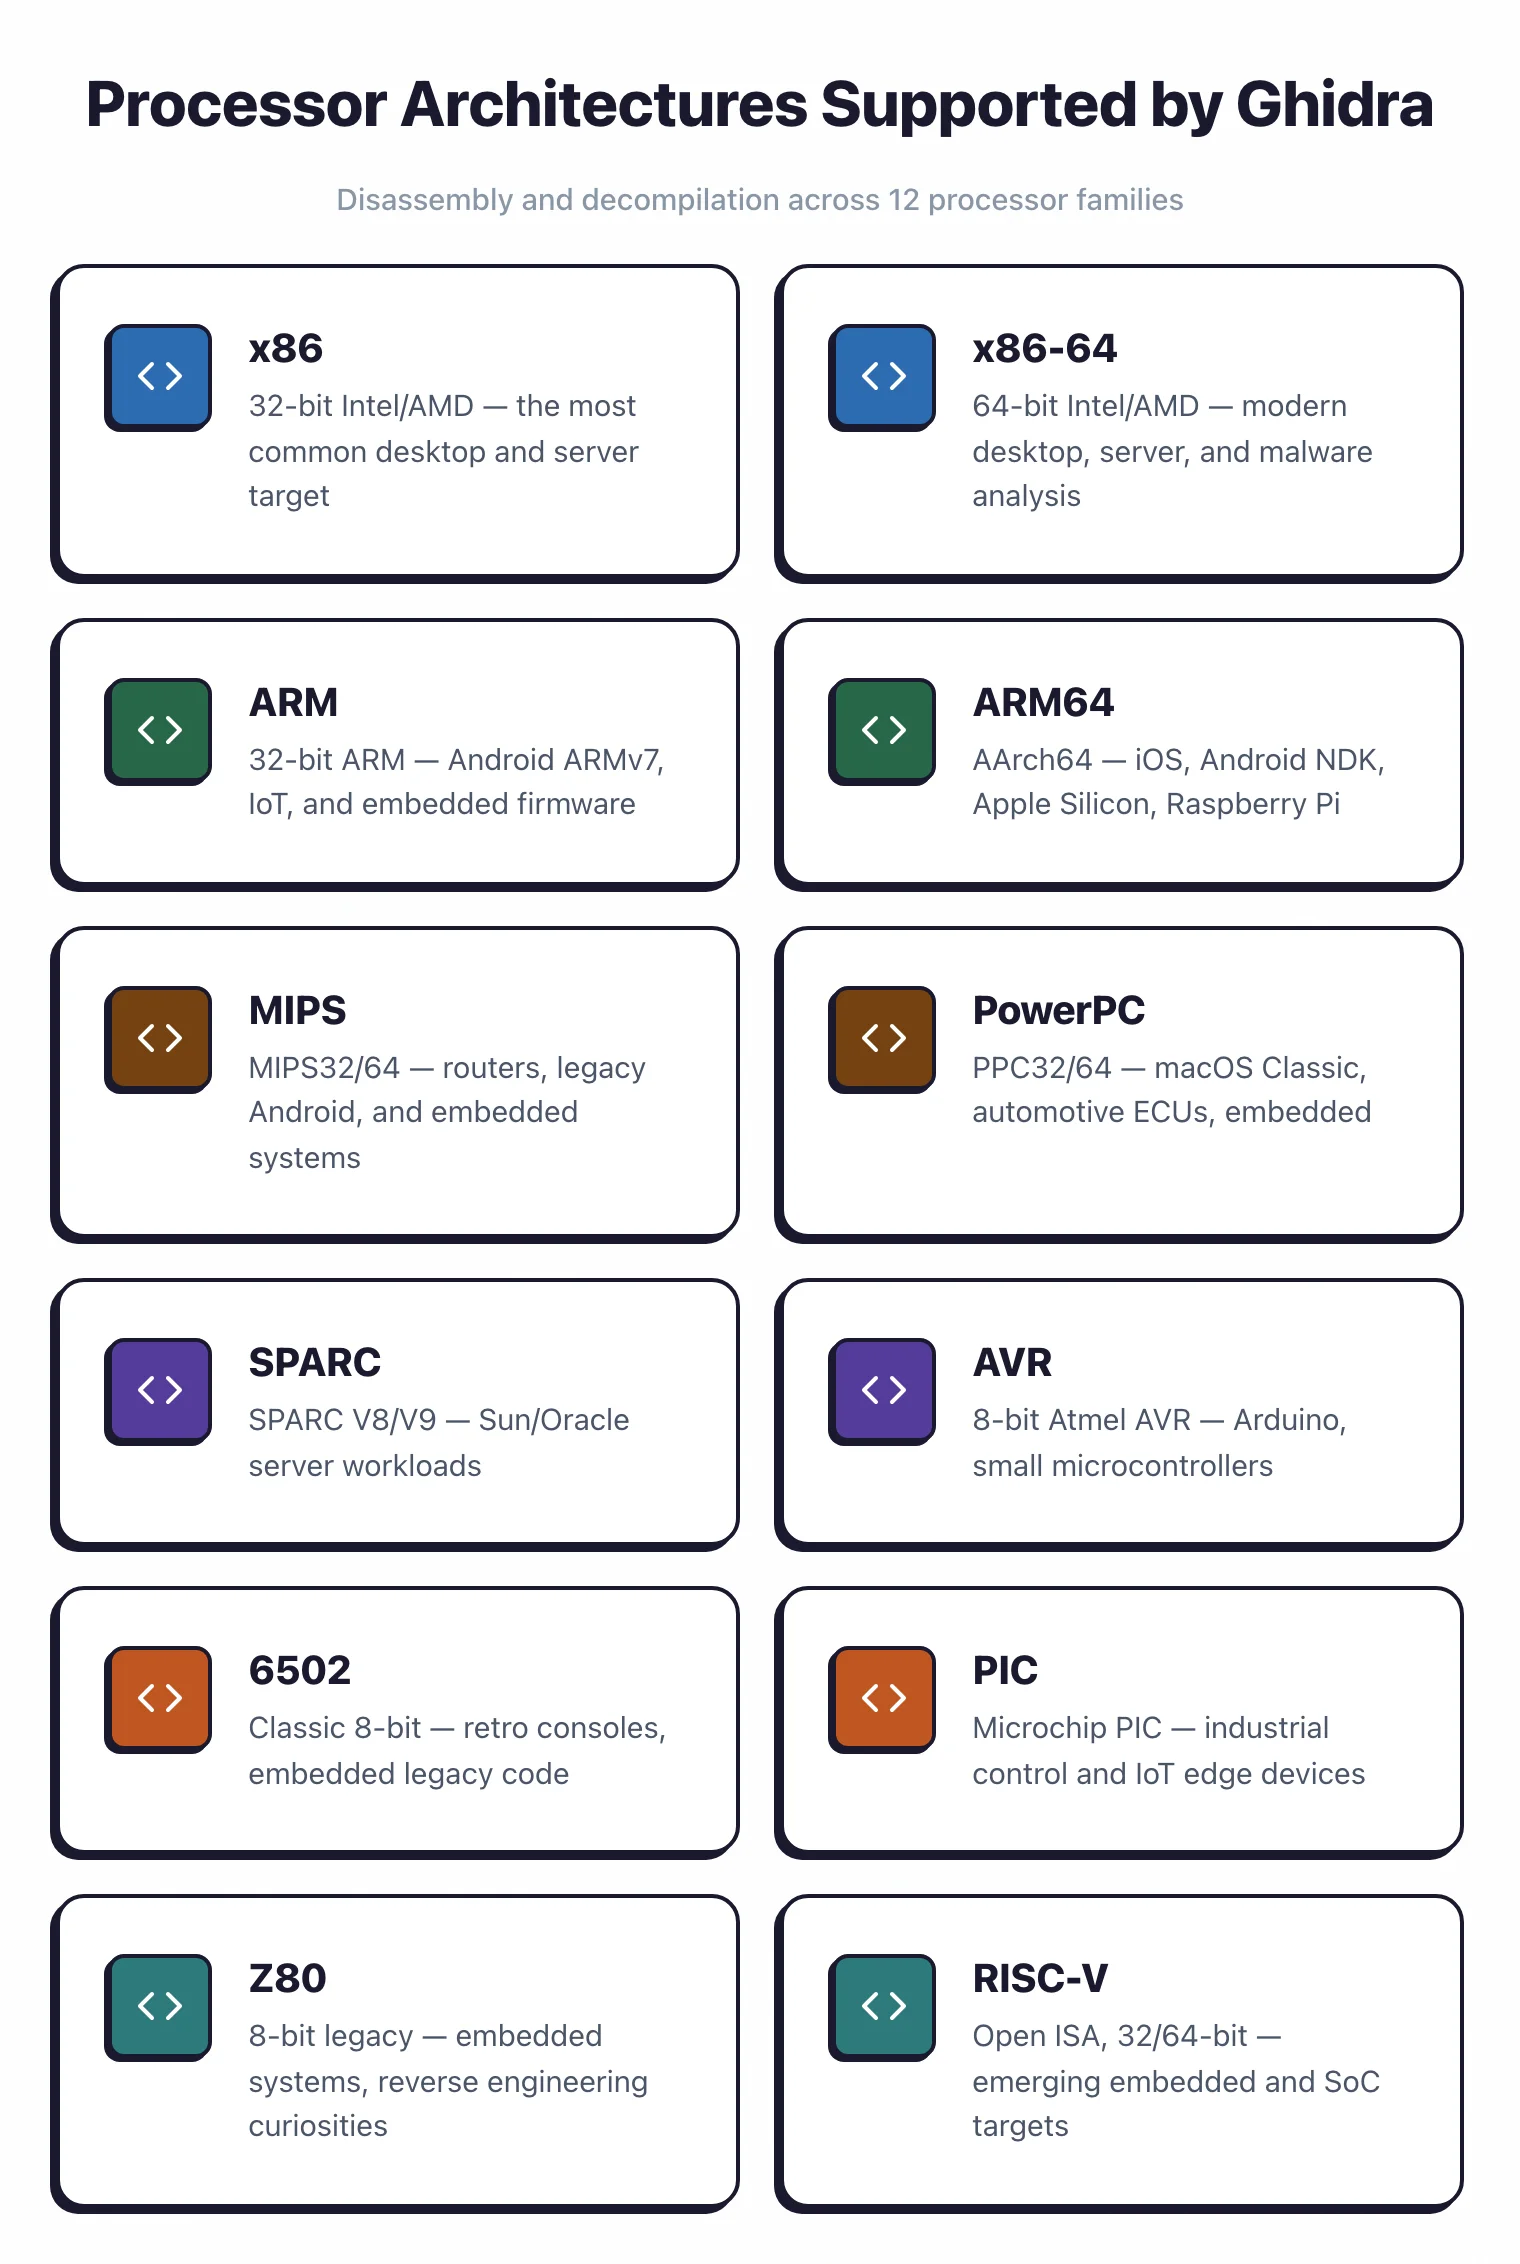
Ghidra covers x86, x86-64, ARM, ARM64, MIPS, PowerPC, SPARC, RISC-V, and dozens more processor families via its SLEIGH processor-spec language.
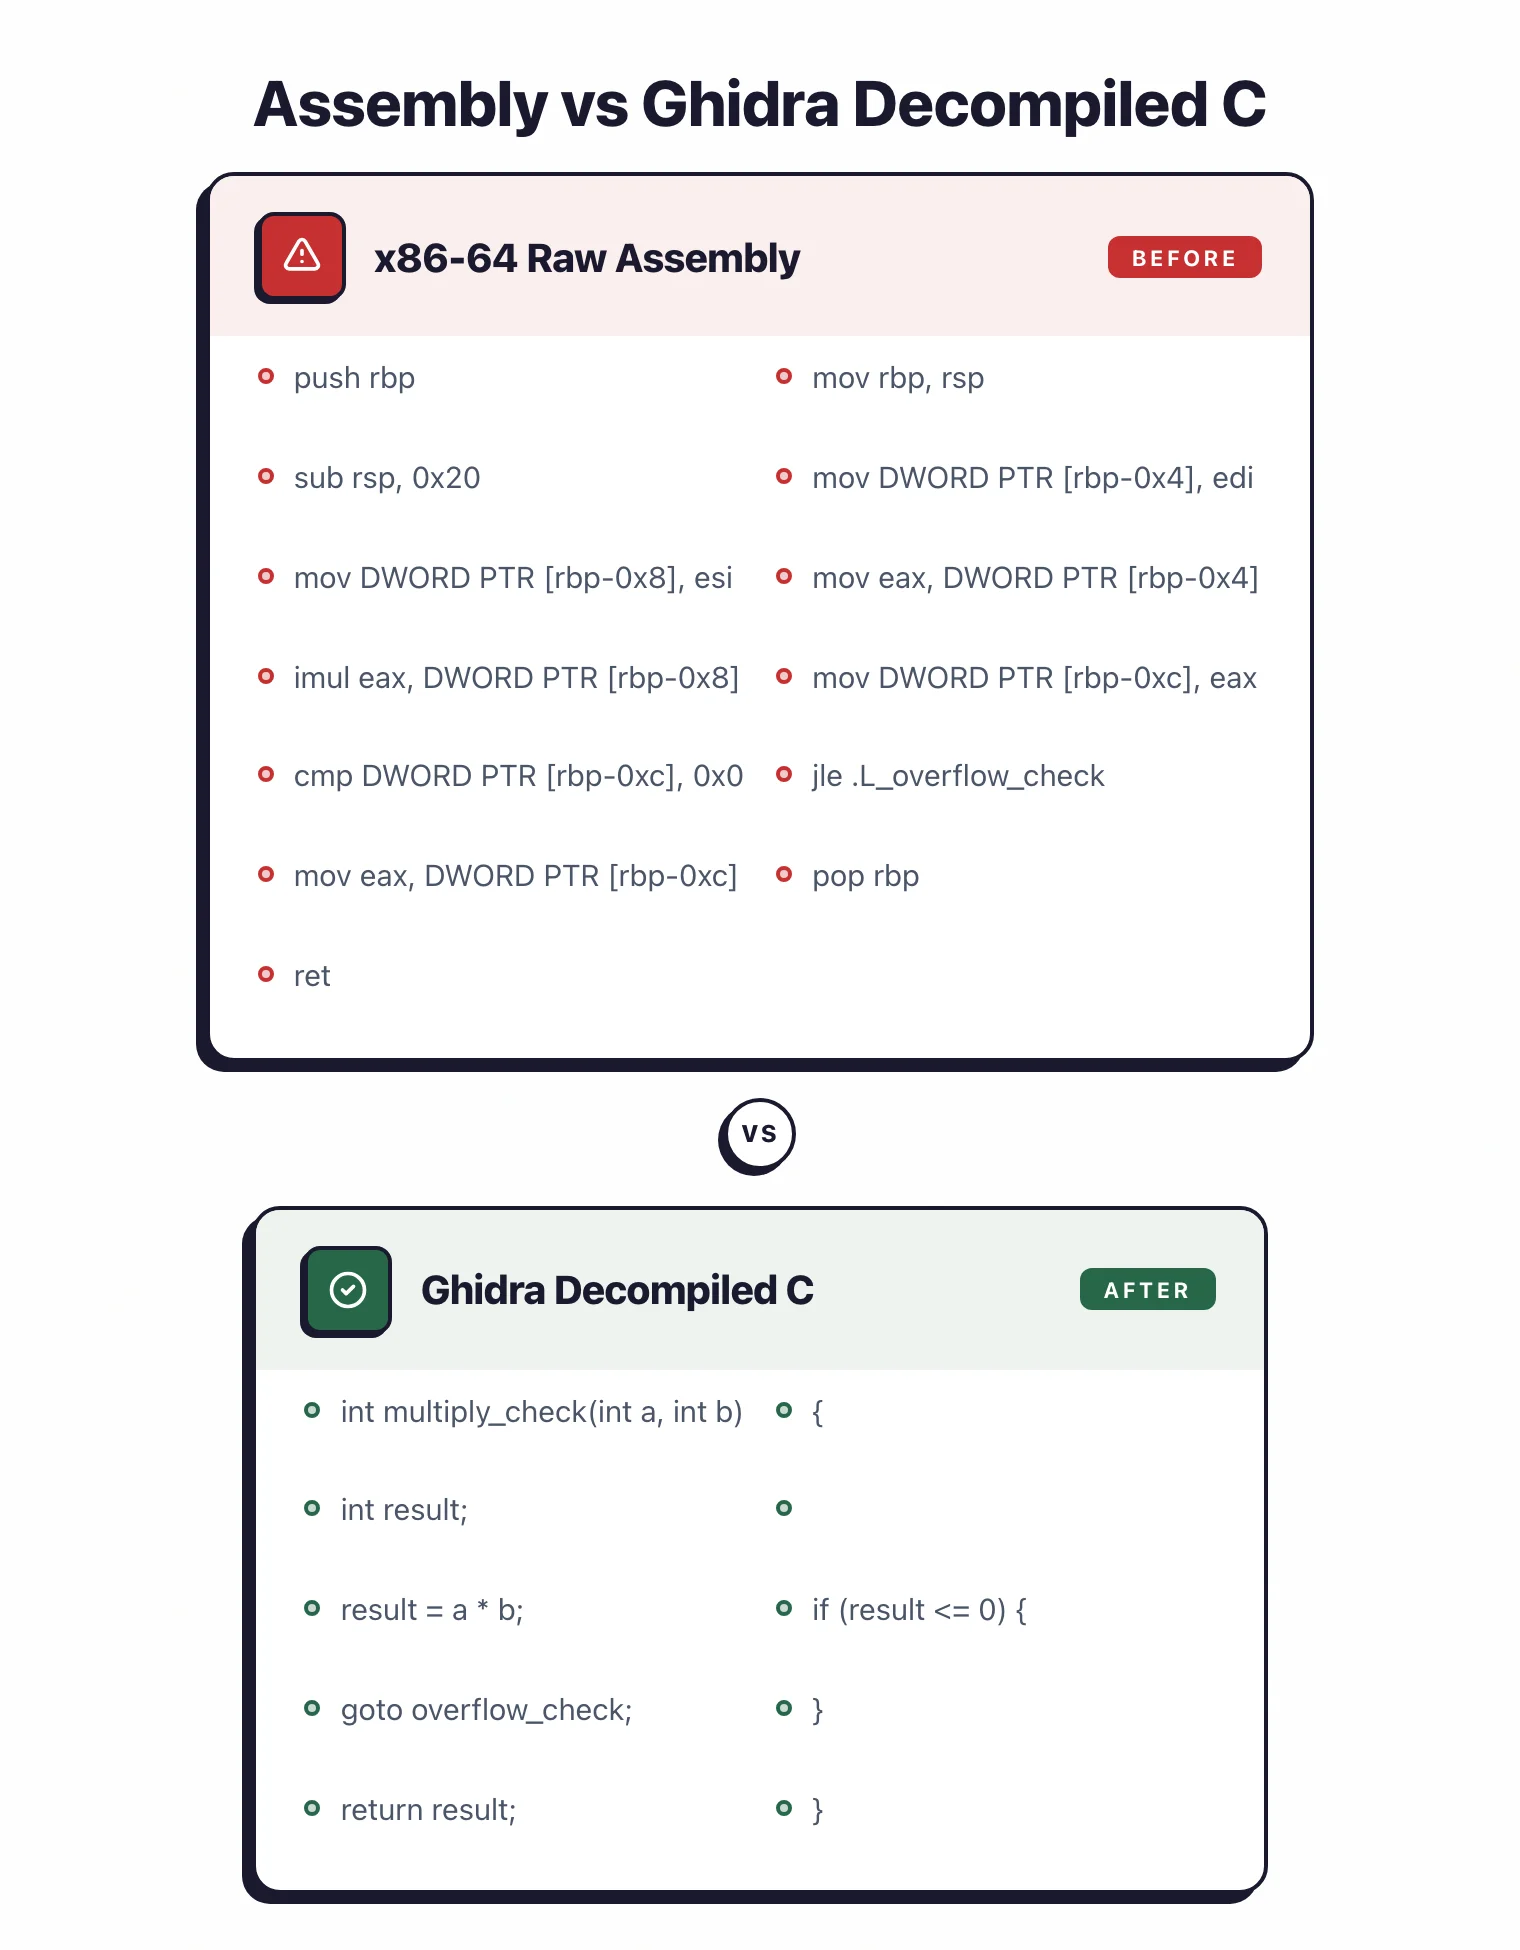
The decompiler converts assembly into C-like pseudocode that is usually readable and accurate, which cuts reverse engineering time compared to working from raw assembly.
The intermediate representation (p-code) is what makes cross-architecture analysis work (more on that below).
Ghidra’s collaborative features let multiple analysts work on the same project at once, sharing annotations, function names, and analysis results in real time without duplicating each other’s work.
Pick your next step
Ghidra vs Radare2
Side-by-side breakdown of the two main free reverse-engineering suites — pick the one that fits your workflow.
→Pair with Jadx
Jadx handles the Java/Kotlin layer of an APK while Ghidra reverses the native .so libraries.
→Browse the category
All mobile and binary analysis tools I've reviewed, with strengths, gotchas, and pricing.
→What are Ghidra’s key features?
Disassembly and Decompilation
Ghidra’s disassembler produces accurate assembly listings with automatic function identification, call graph construction, and cross-reference generation. The auto-analysis phase applies hundreds of analyzers to identify code patterns, resolve indirect calls, and reconstruct high-level structures.
The decompiler output is competitive with commercial alternatives, producing C pseudocode that often compiles or serves as the basis for vulnerability research. Variable type inference, structure recovery, and control flow reconstruction make complex binaries readable.
Mobile Binary Analysis
For mobile security testing, Ghidra handles the native code layer. Android apps often include native libraries (.so files) for performance-critical operations or to protect sensitive logic. Jadx handles the Java/Kotlin code, while Ghidra reverse engineers these compiled libraries.
On iOS, all app code is compiled to native ARM64 binaries. Ghidra loads Mach-O executables directly, so you can analyze iOS apps without a jailbreak.
Combined with Frida for runtime instrumentation, you can validate your static analysis findings dynamically.
Pro tip: For Android native library triage, pair Ghidra's static decompiler with Frida scripts that hook the JNI entrypoints — static pseudocode tells you what a function could do, Frida tells you what arguments it actually receives at runtime.
Debugging and Dynamic Analysis
Ghidra 11.3 added an integrated debugger that connects to GDB, LLDB, and WinDbg.
You can step through code, set breakpoints, examine memory, and watch runtime behavior without leaving the Ghidra interface. Having static and dynamic analysis in one view cuts context-switching.
For mobile testing, debug Android native libraries over GDB on a rooted device, or iOS binaries over LLDB on a jailbroken device. The debugger syncs with your static annotations, so your comments and variable names stay in view as you trace execution.
Scripting and Automation
The scripting API is how I automate the boring parts. The Python and Java APIs expose nearly every piece of the framework, so scripts can find specific code patterns, extract cryptographic constants, or generate custom reports.
The plugin architecture goes a step further: you can ship whole new analysis capabilities. Community plugins cover binary diffing, custom decompiler outputs, and integrations with other security tools.
Collaborative Reverse Engineering
Ghidra Server lets teams share projects in a central repository with version control. Multiple analysts can work on different parts of a binary at the same time, with changes synchronized in real time.
That pays off on large mobile apps or complex malware where one person would spend weeks getting oriented.
When to use Ghidra
Strengths:
- Free and open source with no licensing costs
- Active NSA development with regular releases
- Decompilation quality competitive with commercial tools on modern binaries
- Architecture support covers mainstream mobile and desktop processors
- Collaborative features for team-based analysis
- Extensible via Python/Java scripting and plugins
- Large community with documentation and tutorials
- Cross-platform (runs on Windows, macOS, Linux)
Limitations:
- Steeper learning curve than specialized mobile-only tools
- GUI can be overwhelming for beginners with many panels and options
- Large binaries may require significant RAM and processing time
- Some third-party plugins are less mature than IDA Pro equivalents
- Auto-analysis can take time on complex executables
Combine Ghidra with Hopper for macOS/iOS-specific analysis, Jadx for decompiling Android apps, radare2 for scriptable binary analysis, and Objection for rapid mobile pentesting.
Ghidra system requirements
Ghidra 11.3 requires OpenJDK 21 (64-bit), 4 GB of RAM, 4 GB of free disk, and a 64-bit Linux, macOS 10.13+, or Windows 10+ host. Earlier JDK versions fail at launch with a class-file-version error.
| Component | Minimum | Recommended |
|---|---|---|
| Java | OpenJDK 21 | OpenJDK 21 (latest LTS patch) |
| RAM | 4 GB | 16 GB (32 GB for >50 MB binaries) |
| Disk | 4 GB free | 20 GB (projects grow fast) |
| CPU | x86-64 or ARM64 | Apple Silicon M1/M2/M3 runs natively |
| OS | Ubuntu 20.04+, macOS 10.13+, Windows 10+ | Same |
Apple Silicon Macs work without Rosetta because the ARM64 JVM handles it. On Linux, I install OpenJDK with the package manager (apt install openjdk-21-jdk or the Fedora/Arch equivalent). On Windows, the Eclipse Temurin installer from adoptium.net
is the cleanest path.
How to install Ghidra
Ghidra installs as a single extract-and-run step, with no package manager, service, or daemon required. The whole process takes about five minutes once Java 21 is on the machine.
brew install openjdk@21. On Ubuntu: sudo apt install openjdk-21-jdk. On Windows: download from adoptium.net
.~/tools/ghidra_11.3 on Linux/macOS, C:\ghidra\ghidra_11.3 on Windows). Run ghidraRun on Linux/macOS or ghidraRun.bat on Windows. The first launch takes 10 to 20 seconds while the JRE warms up.After setup, Window → Symbol Tree → search main is usually the fastest path into a binary’s logic.
Typical Ghidra workflow for malware triage and CTF
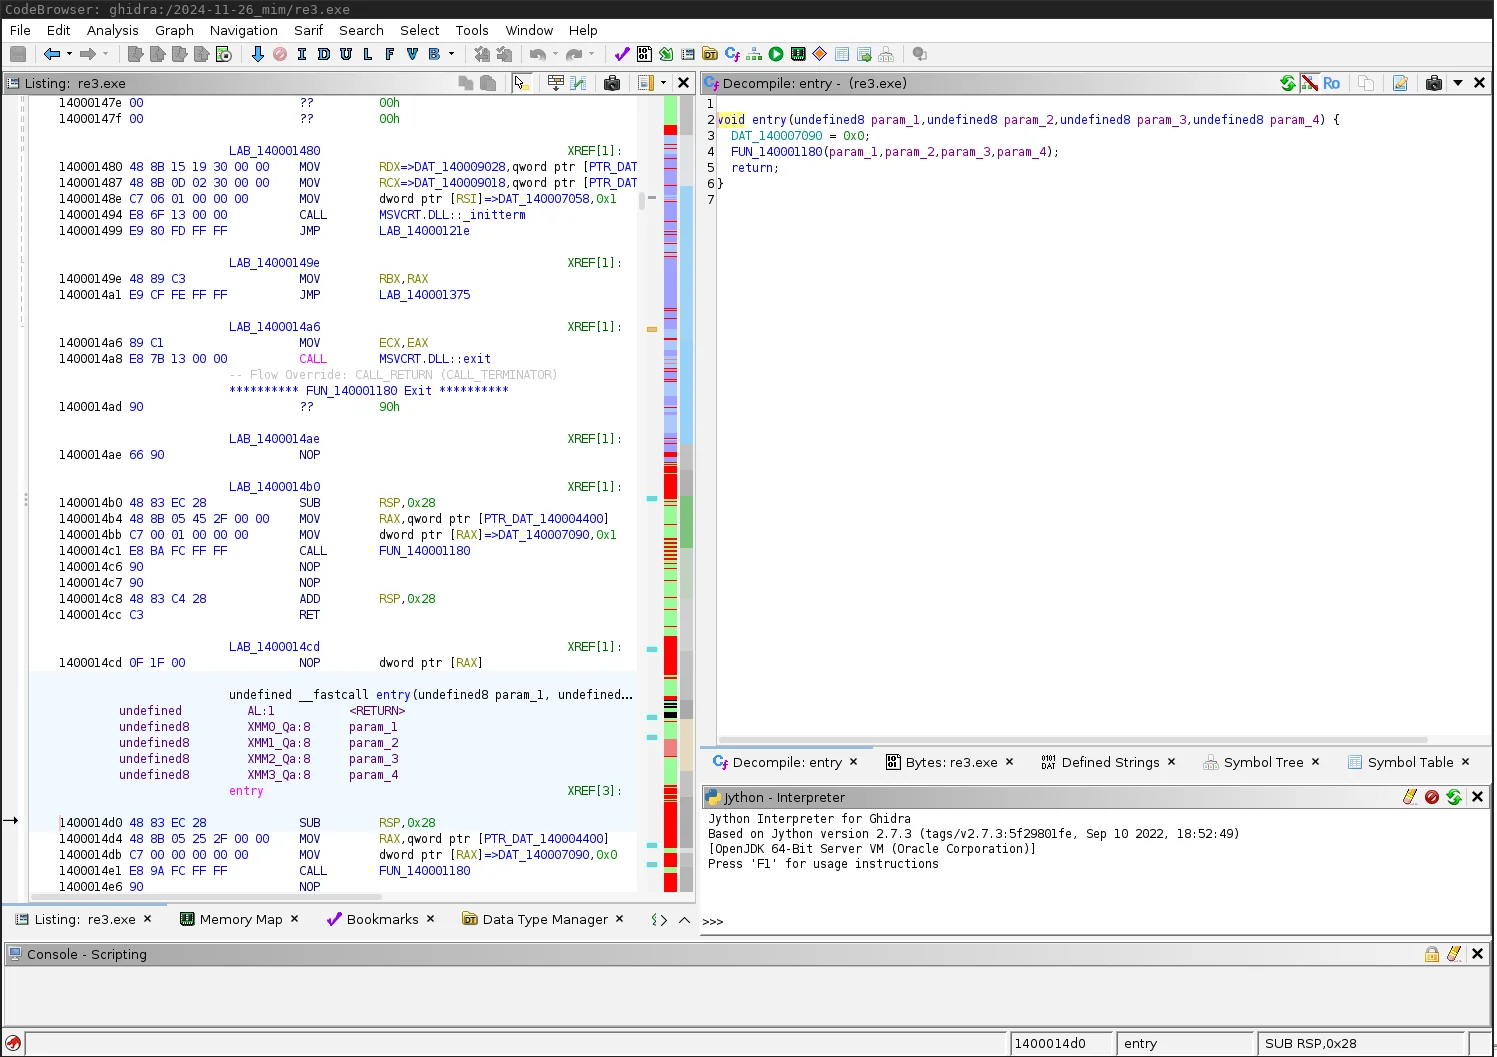
The common entry point is malware triage or CTF reverse engineering. Drop the binary into a new Ghidra project, let auto-analysis run, then head straight to the decompiler. The pseudo-C output is usually clean enough that an analyst can annotate functions and track data flow within minutes rather than hours. Public reverse-engineering write-ups apply this same flow to stripped ARM64 ELF samples, obfuscated Android native libraries, and Windows PE malware families that end up referenced in public threat reports.
Where Ghidra genuinely earns its keep is in the scripting API. A short Python script can walk every function, flag any that XOR-loops over a byte array of length 16 or 32, and dump the candidates to a CSV — minutes of automation that would take days in a debugger. The Java and Python APIs cover the full analysis object model, so the limit is knowing what you want to automate.
The frustrations are real too. The Java Swing UI shows its age: panels get detached, themes do not always match the host OS, and resizing the decompiler pane is a small daily annoyance. Large binaries (50 MB+ Windows system DLLs, for example) can chew through 8 GB of RAM during auto-analysis, so a separate headless project on a VM is the typical workaround.
P-Code: why Ghidra’s IR matters
The single most interesting design choice in Ghidra is that the decompiler does not work on native x86 or ARM instructions. It lifts every supported architecture into a register transfer language called P-Code and does all of its analysis on that IR.
P-Code models the CPU as a set of varnodes (typed memory/register slots) and a small RISC-like instruction set. One COPY, LOAD, INT_ADD, or CALL opcode behaves identically whether the source was x86-64, ARM64, MIPS, or an 8051 microcontroller. That is the whole point: data-flow, alias analysis, constant propagation, and decompilation are written once against P-Code, and every architecture benefits.
Practically, this is why I prefer Ghidra’s scripting API for cross-architecture work. I can write one Python pass that walks every CALL varnode, checks its first argument for tainted flow from a recv() return, and it runs on MIPS firmware, ARM64 iOS binaries, and x86-64 malware without change. IDA’s Microcode is similar in spirit but is less exposed and less documented; for portable, architecture-agnostic analysis passes P-Code is the more pleasant target.
The IR also powers Ghidra’s pcode emulator and the SLEIGH processor-spec language. Adding a new CPU to Ghidra means writing a SLEIGH file that maps its native instructions to P-Code sequences, with no decompiler rewrite needed. That is how community contributors have shipped support for RISC-V, Xtensa, and a long tail of embedded targets.
Scripting, Ghidrathon, and the ML-assisted decompilation wave
The headless scripting interface is where Ghidra quietly outperforms most commercial alternatives. analyzeHeadless takes a project directory, a binary, and a Python or Java script, then runs the full auto-analysis plus your script as a batch job. No GUI, scriptable from CI, and parallelisable with GNU parallel.
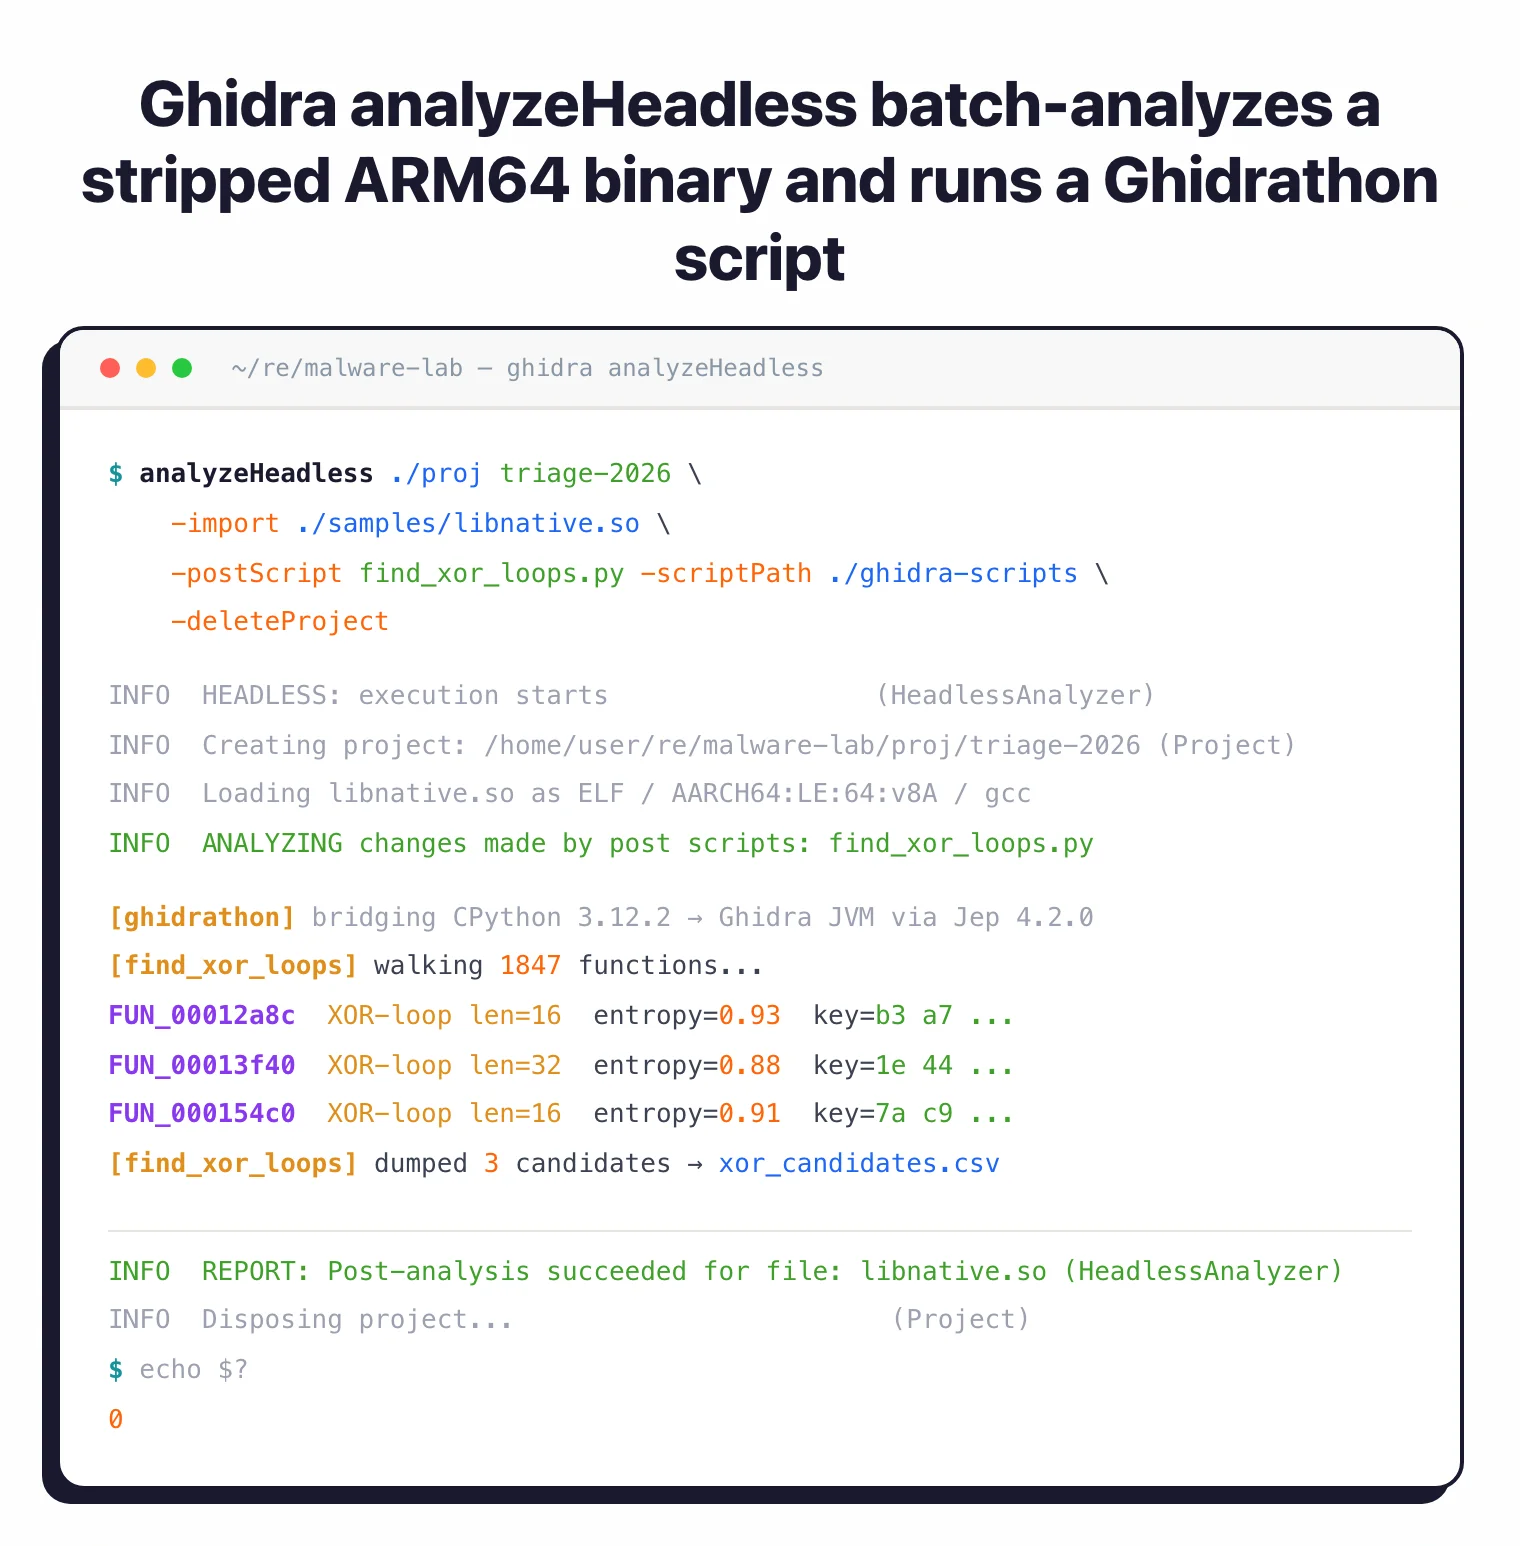
The catch used to be the scripting language: built-in Python support is Jython (Python 2.7), which cannot import modern packages like capa, angr, or transformers. The fix is Ghidrathon
, an extension from Mandiant’s FLARE team that bridges Ghidra to your local CPython 3.8+ via Jep. Install it, and suddenly every Python 3 library in your venv is reachable from a Ghidra script.
That matters because the research frontier has moved to LLM-assisted cleanup of decompiler output. DIRTY (Chen et al., USENIX Security 2022
) trained a transformer to recover meaningful variable names and C types from Hex-Rays output, and similar techniques have since been applied to Ghidra’s P-Code pseudo-C. Retargetable neural decompilation (Hosseini & Dolan-Gavitt, BAR 2022
) goes further and treats lifting itself as a translation problem. None of these tools ship inside Ghidra, but with Ghidrathon you can call them from a script pass: feed the decompiler’s C into a local model, write the suggested names back via currentProgram, and commit the result to your shared Ghidra Server project.
![DIRTY paper Figure 1 contrasting an original C struct function with its decompilation into float arrays v1[2] and v2[2], illustrating lost variable names and types](/images/tools/ghidra/03-dirty-paper.webp)
For a free vs free comparison of Ghidra and the other obvious open-source option, see Ghidra vs Radare2 .
Common Gotchas
- Java version conflicts — Ghidra 11.3 requires Java 21. Running it against an older JDK (11 or 17) produces a cryptic launch error. Set
JAVA_HOMEexplicitly or useghidraRun -Djava.home=/path/to/jdk21to override. - UI feels dated — The Swing interface can look off on HiDPI displays. Set
_JAVA_OPTIONS=-Dsun.java2d.uiScale=2.0on Linux or enable HiDPI in the launch script on macOS to fix blurry rendering. - Decompilation quality varies by optimization level — Heavily inlined or link-time-optimized binaries (LTO,
-O3) produce noisier pseudo-C with anonymous structs and split variables. Budget extra time for O3 binaries; the assembly listing is often clearer than the decompiler output in those cases. - Slow on large binaries — Auto-analysis of binaries over 20 MB can take 10–30 minutes and push memory usage above 8 GB. Increase the heap in
support/launch.properties(MAXMEM=16G) before loading large targets. - Collaborative analysis needs headless setup — The Ghidra Server for shared projects requires a separate server install and is not trivial to configure. For quick team collaboration, share the
.gprproject directory via a shared drive as a simpler alternative. - Processor modules vary in quality — ARM64 and x86-64 modules are excellent. Some less-common architectures (older DSPs, custom embedded CPUs) have incomplete SLEIGH specs that affect decompiler output. Check the GitHub issue tracker before trusting results for exotic targets.
Ghidra for Mobile RE
Ghidra is my preferred static analysis tool for Android native libraries. Most APKs worth reversing include at least one .so file compiled for ARM64. I extract it with apktool
, then load it directly into Ghidra. The decompiler handles JNI function signatures well once you apply the JNI_OnLoad entry point and let the type propagation pass run. Pairing this with jadx
for the Java/Kotlin layer gives a complete picture: jadx shows the business logic and which native methods are invoked, while Ghidra reveals what those methods actually do at the CPU level.
For iOS, Ghidra loads Mach-O ARM64 binaries directly. I use it alongside the mobile security tools workflow: static analysis in Ghidra to identify interesting crypto or authentication routines, then Frida to hook those routines at runtime on a jailbroken device. The combination cuts the time between “what does this binary do?” and “here is the exact network request it makes with a forged session token.”
Ghidra for Vulnerability Research
Ghidra is the open-source standard for vulnerability research on compiled binaries. The typical workflow for memory safety issues starts with the Symbol Tree: search for dangerous function calls (strcpy, sprintf, gets, memcpy) and trace their call sites back through the decompiler to confirm whether user-controlled input reaches them unchecked.
The cross-reference view (XREF) makes this fast — click any function and Ghidra lists every call site. For CVE research, the Version Tracking feature diffs two binary releases side-by-side, highlighting patched functions so you can see exactly what a vendor fixed and assess whether exploitation is viable. Combined with the scripting API, you can automate this pattern across a batch of firmware images or SDK releases.
SAST tools analyze source code; Ghidra fills the gap when source is unavailable — third-party SDKs, closed-source components, or IoT firmware extracted from devices.
Ghidra Alternatives for AppSec Teams
The main Ghidra alternatives for AppSec teams are Binary Ninja, Cutter, and IDA Pro. Binary Ninja (commercial, $299 one-time personal license with one year of updates) offers a cleaner scripting API and better native Python 3 support without the Ghidrathon bridge — teams that write heavy analysis automation often prefer it.
Cutter is a free GUI frontend for radare2, suitable for analysts who want Ghidra-like navigation without the Java dependency. IDA Pro remains the commercial standard with the best third-party plugin ecosystem, though its perpetual license cost is prohibitive for individuals. IDA Free handles x86 32-bit and 64-bit binaries and includes a cloud-based x86 decompiler (local decompilation requires a paid license).
For pure Android app analysis without native libraries, Jadx handles DEX bytecode without the reverse engineering overhead. For mobile app assessments, the usual split is Ghidra for native code and Jadx for managed code — they complement rather than replace each other.
Frequently Asked Questions
What is Ghidra?
Who maintains Ghidra?
Is Ghidra safe to use?
Can Ghidra analyze mobile app binaries?
Can Ghidra decompile APK files?
.so files from lib/arm64-v8a/ (or the equivalent ABI directory) and load them into Ghidra to decompile the C/C++ logic. I pair Jadx for Java/Kotlin with Ghidra for native code to cover the whole app.Can Ghidra decompile C++?
Does Ghidra run on M1 Mac?
brew install openjdk@21), point JAVA_HOME at it, and Ghidra launches and performs normally. No Rosetta translation needed.What are Ghidra's system requirements?
-Xmx override to raise the heap.